
pcpaogkiacmmehpclbomfdhknjmndgpf

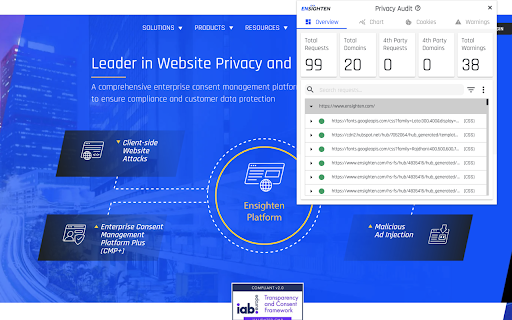
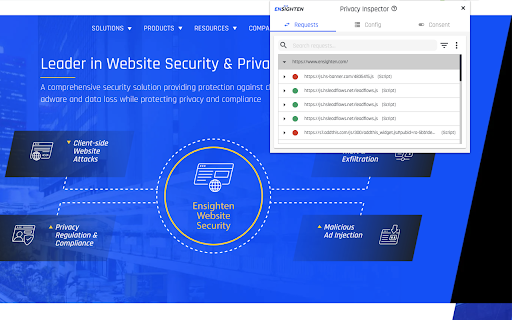

*** This extension is now deprecated due to the integration into CHEQ and also owing to Chrome extensions moving to MV3. Please install the new CHEQ Developer Tools extension to continue using this extension tool-set: The Ensighten Developer Tools extension adds functionality to modify content loaded from the Ensighten system on websites. Users are able to change which account is loaded on an existing page, remove Ensighten from pages, or add Ensighten to new pages on their local machine. As of 2021 this extension will also feature the Privacy Inspector feature that allows the user to inspect request and consent data linked to the Ensighten Privacy solution. It also saw the addition of the Privacy Audit feature which allows the user to audit any web page to check for client-side vulnerabilities. As of 2022 the server-side tagging explorer was added to allow the user to inspect their SST implementation and debug how tags are perfoming server-side in real-time.

CHEQ Developer Tools
Streamline troubleshooting for your tag management and privacy workflows with Ensighten by CHEQ. The CHEQ Developer Tools extension includes the Bootstrap Manager, Visual Tagger, Privacy Tools and Server-Side Tagging (SST) Explorer. - The Bootstrap Manager enables you to modify content loaded from the Ensighten system on websites. For a given page, you can change which Ensighten Bootstrap is loaded, block Ensighten from loading, or add Ensighten to new pages on their local machine. - The Visual Tagger enables you to test and troubleshoot tagging implementations for a specific Bootstrap. - The Privacy Inspector feature allows you to inspect request and consent data linked to the Ensighten Enforce solution. The Privacy Audit feature allows you to audit any web page to check for client-side vulnerabilities. - The server-side tagging explorer enables you to inspect your SST implementation and debug how tags are performing server-side in real-time.

MiaProva
MiaProva facilitates organizational scale and visibility into optimization programs. This extension is for Adobe Target end users. MiaProva's Chrome Extension 2.2.0.2 Update Updated the colors of the icon to make it easier to see when the extension is on or off and improved the loading/unloading of the Chrome Extension MiaProva's Chrome Extension 2.1.0.2 Update: We've added support to copy and download the Adobe Target server calls (mbox calls) as well as the WebSDK network calls. This will be helpful as organizatations enhance their WebSDK use or migrate from at.js to the WebSDK. MiaProva's Chrome Extension 2.1.0.1 Update: Added support for sites that have site injectors and don't provide a URL to Adobe Target. MiaProva's Chrome Extension 2.1.0.0 Update: New Branding and Design. MiaProva's Chrome Extension 2.0.1.0 Update: Added additional support for older at.js versions and made some CSS tweaks. MiaProva's Chrome Extension 2.0.0.0 Update: - Support for Adobe's WebSDK and Adobe Target - New Network Panel exposing Adobe Target Server calls along with any WebSDK requests and search functionality - Highlighting of tested content areas when the VEC was used - Visibility into Response Tokens with each modification from an Adobe Target Activity - A feed into the MiaProva Blog - Updates to Profile retrieval based on the Adobe ECID and Client ID (when WebSDK is detected) Below is a small list of features by each MiaProva Chrome Extension tab. We also have more information available here: https://www.miaprova.com/blog/adobe-target-chrome-extension-brought-to-you-by-miaprova/. ACTIVITIES tab: Here, Adobe Target users can easily see what activities and experiences they are members of as they traverse their digital properties. They can also see what other activities are mapped to their Adobe Target ID, which is very helpful for understanding cross-test participation. Target users will also see the data communicated to Adobe Target and a response from Adobe with the order of activities and offers execution for QA purposes. MiaProva also makes the offer code available for easy consumption. The premium feature on the Activities tab is that MiaProva customers can access reporting for any live Adobe Target Activity managed within MiaProva. MiaProva users can also upload test screenshots to those tests within this tab. PROFILE tab: This tab gives Adobe Target users a window into what Profile Attributes and values are associated with their Adobe Target ID. This feature creates an incredible opportunity for Adobe Target users to become more familiar with what Profiles are and how to use them for their personalization efforts. You can view all of your attributes within this tab, add additional attributes (helpful for many reasons!), and edit any of your current non-user—profile attributes. ID tab: Users can quickly see and copy any visitor ID values used in their optimization efforts. We purposely put the mbox3rdPartyId or 1st party ID in the first spot to highlight this underutilized component, which allows Adobe Target users to coordinate tests across devices and use all the rich data available in internal databases. IDEAS tab: Premium Feature—MiaProva's Chrome Extension is directly linked to end-user MiaProva accounts. Users can add test ideas in the context of their site and research. MiaProva will communicate ideas submitted here to its Idea Board for voting and prioritization. Subscribers to new ideas will receive an email letting them know. REPORTS tab: Premium Feature - MiaProva customers can access their test results via MiaProva's Adobe I/O integration. MiaProva also provides lift and statistical confidence calculations and makes them available here. Thank you for checking out the MiaProva Chrome Extension. We would love any feedback, thoughts, or ideas you may have. Please contact us at support@miaprova.com, and we will respond immediately.

Adswerve - dataLayer Inspector+
DataLayer Tools for Digital Analysts The Adswerve dataLayer Inspector+ is a tool kit of utilities for a digital analyst. Inspect Google Analytics activity - Monitor the dataLayer in real time - See the Google Analytics hits in the console, as they happen - Evaluate common dataLayer pushes formats: events and ecommerce Insert additional resources in the page - Push a dataLayer message for setup - Add a GTM container to test it - Insert code into the page to monitor and modify How to use the dataLayer Inspector+: https://adswerve.com/resources/adswerve-data-layer-inspector-2 Update for v2024.11.1.1 Due to new restrictions on external script tags in Chrome extensions, the "Insert GTM Container" option has been removed from dataLayer Inspector+. Follow these steps to insert a GTM container into a web page with the "Inject Code" feature instead: Go to tagmanager.google.com. Under the Admin tab for your container, select "Install Google Tag Manager." As shown in the screenshot below, where it says "Paste this code as high in the of the page as possible," copy just the snippet code content. Note: Do not include , only the code between them. In the DataLayer Inspector popup, under "Add Functionality," check "Inject Code." Paste the code snippet from Tag Manager into the text box that appears. Click the button to "Save Settings & Reload." The GTM container will be inserted until the "Inject Code" box is unchecked and "Save Settings & Reload" is clicked again. Be sure to do this when you've finished testing.

Launch and DTM Switch
Enables the developer to locally override the embedded Launch or DTM library for testing. Allows environment selection and debug toggling for DTM and Launch, by Adobe. This handy extension from the analytics team at Search Discovery allows you to select environments for Adobe Launch and to toggle the debug and staging mode for Adobe Dynamic Tag Management. The debug mode tells the DTM or Launch library to add application messaging to the console. The staging mode for DTM uses the staging library instead of the production library. For sites using Adobe Launch, the switch allows easy switching of environments within a property. Once installed, an icon will appear in the address bar when a site has Adobe Launch or DTM installed. Click on the icon to expose the control panel. Notice of anonymous usage tracking: This extension tracks anonymous usage data. This data helps us understand usage patterns in order to provide a better product. We track interactions within this extension and nothing else. If you would like to opt out of this tracking, just press the gear icon in the upper right of any panel and click “No.” v2.0.12 Update Notes - Another Fix for "Record Environments" functionality ("x-gw-ims-org-id" is now a required header for Launch API) v2.0.11 Update Notes - Fix for "Record Environments" functionality v2.0.10 Update Notes - Fixes for Adobe's new framing of Launch within experience.adobe.com v2.0.8 Update Notes - Support for 99 Environments per Launch Property (previously 25) v2.0.6 Update Notes - Added support for DTM linked launch properties - Added "Clear Environments" button on the settings tab - Allow for Launch debugging to be activated when no environments are recorded Our overhaul of this extension is part of Search Discovery’s larger commitment to the Launch, by Adobe platform and to our clients as they migrate. Find out more about Search Discovery’s solutions for Launch, by Adobe. Feedback : launch-switch-extension@searchdiscovery.com