
mgmachpoeeklnmmiamheacganlehicdb


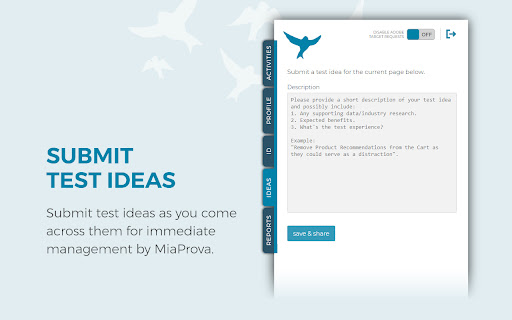
MiaProva facilitates organizational scale and visibility into optimization programs. This extension is for Adobe Target end users. MiaProva's Chrome Extension 2.2.0.2 Update Updated the colors of the icon to make it easier to see when the extension is on or off and improved the loading/unloading of the Chrome Extension MiaProva's Chrome Extension 2.1.0.2 Update: We've added support to copy and download the Adobe Target server calls (mbox calls) as well as the WebSDK network calls. This will be helpful as organizatations enhance their WebSDK use or migrate from at.js to the WebSDK. MiaProva's Chrome Extension 2.1.0.1 Update: Added support for sites that have site injectors and don't provide a URL to Adobe Target. MiaProva's Chrome Extension 2.1.0.0 Update: New Branding and Design. MiaProva's Chrome Extension 2.0.1.0 Update: Added additional support for older at.js versions and made some CSS tweaks. MiaProva's Chrome Extension 2.0.0.0 Update: - Support for Adobe's WebSDK and Adobe Target - New Network Panel exposing Adobe Target Server calls along with any WebSDK requests and search functionality - Highlighting of tested content areas when the VEC was used - Visibility into Response Tokens with each modification from an Adobe Target Activity - A feed into the MiaProva Blog - Updates to Profile retrieval based on the Adobe ECID and Client ID (when WebSDK is detected) Below is a small list of features by each MiaProva Chrome Extension tab. We also have more information available here: https://www.miaprova.com/blog/adobe-target-chrome-extension-brought-to-you-by-miaprova/. ACTIVITIES tab: Here, Adobe Target users can easily see what activities and experiences they are members of as they traverse their digital properties. They can also see what other activities are mapped to their Adobe Target ID, which is very helpful for understanding cross-test participation. Target users will also see the data communicated to Adobe Target and a response from Adobe with the order of activities and offers execution for QA purposes. MiaProva also makes the offer code available for easy consumption. The premium feature on the Activities tab is that MiaProva customers can access reporting for any live Adobe Target Activity managed within MiaProva. MiaProva users can also upload test screenshots to those tests within this tab. PROFILE tab: This tab gives Adobe Target users a window into what Profile Attributes and values are associated with their Adobe Target ID. This feature creates an incredible opportunity for Adobe Target users to become more familiar with what Profiles are and how to use them for their personalization efforts. You can view all of your attributes within this tab, add additional attributes (helpful for many reasons!), and edit any of your current non-user—profile attributes. ID tab: Users can quickly see and copy any visitor ID values used in their optimization efforts. We purposely put the mbox3rdPartyId or 1st party ID in the first spot to highlight this underutilized component, which allows Adobe Target users to coordinate tests across devices and use all the rich data available in internal databases. IDEAS tab: Premium Feature—MiaProva's Chrome Extension is directly linked to end-user MiaProva accounts. Users can add test ideas in the context of their site and research. MiaProva will communicate ideas submitted here to its Idea Board for voting and prioritization. Subscribers to new ideas will receive an email letting them know. REPORTS tab: Premium Feature - MiaProva customers can access their test results via MiaProva's Adobe I/O integration. MiaProva also provides lift and statistical confidence calculations and makes them available here. Thank you for checking out the MiaProva Chrome Extension. We would love any feedback, thoughts, or ideas you may have. Please contact us at support@miaprova.com, and we will respond immediately.

Launch and DTM Switch
Enables the developer to locally override the embedded Launch or DTM library for testing. Allows environment selection and debug toggling for DTM and Launch, by Adobe. This handy extension from the analytics team at Search Discovery allows you to select environments for Adobe Launch and to toggle the debug and staging mode for Adobe Dynamic Tag Management. The debug mode tells the DTM or Launch library to add application messaging to the console. The staging mode for DTM uses the staging library instead of the production library. For sites using Adobe Launch, the switch allows easy switching of environments within a property. Once installed, an icon will appear in the address bar when a site has Adobe Launch or DTM installed. Click on the icon to expose the control panel. Notice of anonymous usage tracking: This extension tracks anonymous usage data. This data helps us understand usage patterns in order to provide a better product. We track interactions within this extension and nothing else. If you would like to opt out of this tracking, just press the gear icon in the upper right of any panel and click “No.” v2.0.12 Update Notes - Another Fix for "Record Environments" functionality ("x-gw-ims-org-id" is now a required header for Launch API) v2.0.11 Update Notes - Fix for "Record Environments" functionality v2.0.10 Update Notes - Fixes for Adobe's new framing of Launch within experience.adobe.com v2.0.8 Update Notes - Support for 99 Environments per Launch Property (previously 25) v2.0.6 Update Notes - Added support for DTM linked launch properties - Added "Clear Environments" button on the settings tab - Allow for Launch debugging to be activated when no environments are recorded Our overhaul of this extension is part of Search Discovery’s larger commitment to the Launch, by Adobe platform and to our clients as they migrate. Find out more about Search Discovery’s solutions for Launch, by Adobe. Feedback : launch-switch-extension@searchdiscovery.com

Universal Adobe Debugger
Universal Adobe Debugger is a powerful Chrome extension for debugging Adobe Analytics, Adobe Experience Platform (AEP), Adobe Web SDK, and Adobe Launch (Tags) implementations. Built by analysts for analysts, this tool helps you validate tracking, inspect payloads, and troubleshoot Adobe Experience Cloud integrations directly from the browser console. Simply open DevTools and trigger Adobe Analytics or Web SDK calls to instantly view structured, readable debugging output. Log and inspect Adobe Analytics server calls (AppMeasurement, s.t, s.tl) directly in the console for faster troubleshooting and QA validation. Access rule execution details and implementation diagnostics to verify Launch configurations with ease. Monitor Adobe Experience Platform Web SDK requests and XDM payloads with clean, formatted console output — no more digging through nested objects. Replace Adobe Launch libraries seamlessly to test and validate implementations in real time. Access a curated collection of debugging snippets for analytics validation and consent troubleshooting. Verify Adobe Launch rules and data layer mappings Improve tracking accuracy and data quality Streamline QA workflows for analysts and developers Whether you're an Adobe Analytics specialist, AEP implementer, Launch developer, or digital analyst, Universal Adobe Debugger helps you debug smarter and ship cleaner data. Found a bug or have a feature request? Contributions and feedback are welcome. Visit our GitHub repository at https://github.com/cthae/Adobe-Launch-Debugger to report issues or suggest improvements. Changelog: 2025-04-06 -> 1.25 * [x] Add an option to disable displaying of the Target "decisioning" web sdk requests. To reduce clutter. * [x] Identify "decisioning" web sdk requests as Target rather than PV. Correct the call name. 2025-03-30 -> 1.24 * [x] Add a color picker set of settings that would allow users configure the colors of console printouts. * [x] Make a snippet shortcut to delete all cookies and local storage present on the active tab. * [x] Make OT printouts not fuzzy again. 2025-03-09 -> 1.23 * [x] CSS refactory * [x] Better bookmarks design * [x] Add an option for the light mode for the extension's UI. * [x] _satellite decided to become touchy about setDebug() using a truthy arg. Replace 1 with true. 2024-12-10 -> 1.22 * [x] Reimplementation of Adobe Experience Cloud Bookmarks * [x] Rename tabs to icons * [x] Move the redirects tab to somewhere else. To Settings and Home probably * [x] Make a New Tab for bookmarks * [x] Add a setting to choose the tab that would be opened by default when the popup renders (Home/Settings/Bookmarks) * [x] Clean up redirections. Add a message for when there's no redirections yet. 2024-11-08 -> 1.21 * [x] Change the extension icon depending on the env: * grey for when the extension hasn't yet executed all code or doesn't have the permission to do so; * green indicates that the Launch env is production; * yellow indicates that the Launch env is dev or staging; * red indicates that the Launch library is not loaded or loaded incompletely. Basically, _satellite?.environment?.stage is falsy. The rest of the functionality won't be stopped by this, however. * [x] Update the extension icon. * [x] Disable Launch UI improvements on by default. * [x] Multiple small bugfixes and refactories. 2024-10-04 -> 1.20 * [x] Add onInstalled/onStartup callbacks to set the default set of settings specifically for those who don't open the popup after installation. * [x] Support for Mozilla FF. Same extension. Cross-browsers. Seems like mostly only background will have to be reimplemented, but many APIs may be off. We'll see. 2024-10-01 -> 1.10 * [x] Appmeasurement: Prettify the product string printing. * [x] Appmeasurement: Add transaction id in the product string prettifier. * [x] Implement Launch UI improvements POC: * [x] Launch UI: Add the red indicator whenever a lib is not selected. * [x] Launch UI: Add a hint about how to change the Launch UI via Chrome flags. * [x] Add an option to print general alloy config in the snippets tab. Make sure it does so for all Alloy instances. 2024-09-02 -> 1.09.1 * [x] Rename the content-script.js to something more interesting. It's visible in the console and can be filtered by. * [x] Web SDK: Further improve the custom logging, allowing shorthands: p12/c12/v12/e12/l2. * [x] Apply all the shorthanded custom logging to Appmeasurement logging too. 2024-08-26 -> 1.09.1 * [x] Fix a bug in custom logging, in event shortcuts for the data.__adobe.analytics usecases. * [x] Fix a bug in custom logging, in prop shortcuts for the data.__adobe.analytics usecases. 2024-08-25 -> 1.09: * [x] Web SDK: Expose the event type in the logging header. * [x] Web SDK: Improve the custom logger to also check the data.__adobe.analytics object when using shortcuts. * [x] Web SDK: Make it easier for non-technical people to use the custom logging: don't require them to specify the full path to evars, props or events for xdm payloads. If users ask for evars and it's an xdm event, just add the correct path to it. * [x] Reimplement page load time to something like performance.getEntriesByType("navigation")[0]?.duration 2024-08-20 -> 1.08.1: * [x] Increased the delay at which the response is no longer expected to six seconds. Because AA can be very slow to respond. 2024-08-18 -> 1.08: * [x] Web SDK: On errors, in custom logs, add an indication that the request resulted in an error. This is for people who use filters in the console like pros. Thanks Arun for noticing. * [x] Web SDK: MVP tracking the navigator.sendBeacon() ping network requests. No access to their payloads, however, because the Chrome devteam neglects fixing related bugs. * [x] Delete requests from the map on other callbacks too to avoid misreporting calls as such that didn't receive the server response. 2024-08-14 -> 1.07.01: * [x] Increased the delay at which the response is no longer expected to two seconds. * [x] Cleanup. 2024-08-13 -> 1.07: * [x] Print the extension version, getting it from the manifest. * [x] UX improvements, CSS fixes. * [x] Add a bug submission button in info. * [x] Web SDK: Add an option to log all fields there are, giving the user the raw object. * [x] Add a callback and error logging for "cancelled" requests. That's when the browser cancels the request. And a few other types of requests. Thanks to Arun for the suggestion. * [x] Web SDK: Apply the error logging logic to Web SDK tracking too * [x] Small popup UI improvements. 2024-06-02 -> 1.06 - Byanka: * [x] Replace the counter of PVs and links with AA calls and WebSDK calls * [x] Web SDK: Improve autodebugging: indicate when linkClicks will be treated as pageviews in AA due to the web fields set. * [x] Web SDK: Surface the Edge config ids for every request, make them visible just like AA Report Suites. To ease the debugging of multi-destinational tracking. First 5 characters should suffice. * [x] Web SDK: Improve the tracking of network errors when edge network requests fail. * [x] Web SDK: Refactor logging. Make it less confusing. No more nested groups. * [x] Web SDK: Change the default logging a bit to maybe try and expand the analytics object automatically. * [x] Web SDK: Add a setting to remove the essentially useless xdm fields that are rarely useful to look at. On by default. * [x] Web SDK: Improve the logging for non-object fields. * [x] Web SDK: Add logging for the data.__adobe object. Off by default in settings. * [x] Web SDK: Reinforce the custom logging field, allow people to use the xdm. reference in the list of params. For older versions, please refer to github releases here: https://github.com/cthae/Adobe-Launch-Debugger/releases

Omnibug
Omnibug is a browser extension to decode and display outgoing digital marketing tool requests. Omnibug is a Chrome extension built to ease developing with, debugging, and providing quality assurance to today's analytics, UX/CRO tools, and many other marketing technologies. These tags include the Google Marketing Cloud (including Google Analytics, Google Tag Manager, Doubleclick, and Google Ads), the Adobe Experience Cloud (including Adobe Analytics, Adobe Launch, Adobe Target, Web SDK), Tealium iQ, and many more! Events sent to these MarTech platforms are captured and decoded into a human-readable format, which can be filtered and/or exported. You can view all of our release notes at https://omnibug.io/help/changelog/ and a list of providers we support at https://omnibug.io/help/supported-tags/

AEP Engineer Toolkit
Toolkit for AEP Web SDK engineers. Validate Events, inspect Batch Failures, and analyze implementations with AI. The ultimate AEP Web SDK debugger. Validate XDM ExperienceEvents, inspect batch failure logs, and get AI-powered fixes. Stop guessing what's in your XDM payload. The AEP Web SDK Engineer Toolkit is the essential extension for any digital analytics engineer, implementer, or developer working with Adobe Experience Platform. This toolkit provides four powerful tools in one: a real-time Event Debugger (Free), an AI-powered TagAI assistant (Premium), Advanced Schema Validation (Premium), and an API-driven Batch Inspector with AI Insights (Premium) ? designed to save you hours of debugging time. See your AEP Web SDK events (/interact, /collect) in real-time. This tool is a modern replacement for the classic Adobe Analytics debugger, built specifically for XDM payloads and the AEP Web SDK. - Capture All Beacons: Reliably intercepts both fetch and sendBeacon requests. - Grouped by Page: Events are automatically grouped by the page they fired on for easy analysis. - Clean & Searchable UI: View XDM payloads in a clean, collapsible tree. Search all field names and values with Regex support. - Save & Share Searches: Save your complex search queries to your history for one-click reuse. --- TagAI: Your Implementation Assistant (Premium) --- TagAI is a conversational AI assistant built directly into your browser. Have a back-and-forth conversation about the Adobe Launch library on any site you're viewing — TagAI remembers what you've already asked and builds on it. A subscription is required for all AI modes — built-in proxy (50 requests/day), your own Gemini API key, or OpenAI. - Full Conversation Mode: Hold a multi-turn dialogue with the AI. Ask a question, get an answer, then dig deeper — TagAI retains context across your entire conversation so you never have to repeat yourself. - Context-Aware: TagAI reads the live Adobe Launch (Data Collection) configuration on the page — including Rules, Data Elements, and Custom Code — to give you accurate, site-specific answers. - Saved Chats: Every conversation is saved with an auto-generated title so you can pick up where you left off. Pin important chats so they always stay at the top. - Suggested Follow-Ups: After each answer, TagAI suggests relevant follow-up questions to help you dig deeper without having to think of what to ask next. - Background Processing: AI responses keep streaming even if you close the popup. Reopen it and your conversation will be waiting. - Flexible AI Options: Subscribers get 50 AI requests per day using the built-in Google Gemini proxy (automatically uses the latest available Gemini Pro model), with the option to bring your own Gemini or OpenAI API key for unlimited requests. - Usage Tracker: A live counter in the popup header shows your remaining AI requests for the current day. - Export Answers: Copy responses to clipboard, download as Markdown, or save as PDF for documentation and team sharing. Move beyond simple JSON viewing. Our validation engine automatically checks your live XDM payloads against your official AEP schema, right in your browser. - Per-Tab Schema Selection: Select the active schema for each browser tab from a simple dropdown in the popup. Perfect for multitasking across different projects or sandboxes. - Automatic Schema Matching: Automatically applies the correct schema if the event's meta:altId matches a schema you've imported. - Find Errors Instantly: - Type Mismatch: Highlights fields sent as the wrong type (e.g., string instead of integer). - Missing Required Fields: Warns you if a required field (like _id or timestamp) is missing from the payload. - Unmatched Keys: Flags any fields you're sending that do not exist in your schema, helping you spot typos or outdated implementations. - Custom Field Titles: Toggle between friendly schema "Titles" (e.g., "Page Views") and the raw field names (e.g., web.webPageDetails.pageViews.value). - Download Events: Export all captured events for a page to JSON or CSV. Stop guessing why your AEP batch failed. The Batch Inspector connects directly to the AEP API to give you answers. - One-Click Inspection: The extension automatically finds static Batch IDs in the AEP UI and turns them into clickable links. - Fetch Detailed Logs: Click a link to securely pull the actual failed event logs from the AEP API (requires AIO credentials). - Smart Summary View: Don't read raw JSON. The inspector summarizes thousands of errors, grouping them by error message, field path, and the most common invalid values. - AI-Powered Fixes: Click the AI button next to any error group to get an instant analysis. The AI examines the failed payloads and your site's live Adobe Launch configuration to provide a clear Likely Cause, Debugging Steps, and a Proposed Solution. Managing schemas for multiple clients and sandboxes is now simple. - API Import: Securely connect to your Adobe I/O project, fetch your sandboxes, and import all your ExperienceEvent schemas with one click. - Manual Import: Paste JSON or upload a schema file. The tool intelligently merges all standard field groups (experienceevent-web, experienceevent-device, commerce, search, etc.) automatically. 1. Event Debugger: a. Install the extension, open the popup on a page with the AEP Web SDK, and events will appear. b. (Premium) Go to Options to import your schemas. c. (Premium) Select your active schema from the dropdown in the popup to enable validation. 2. TagAI (Premium): a. Subscribe and open the extension on any site running Adobe Launch. b. Switch to the "TagAI" tab. c. Type a question and click "Ask AI" to start a conversation. Ask follow-up questions naturally — TagAI keeps the full context. d. Use "New Chat" to start fresh or open "Chats" to resume a saved conversation. e. Subscribers get 50 requests per day using the built-in proxy, with the option to bring your own Gemini or OpenAI API key for unlimited requests. 3. Batch Inspector (Premium): a. Go to the extension's Options page > API Import tab. b. Enter your Adobe I/O credentials (Client ID, Secret, Org ID). These are stored locally and never shared. c. Go to the Settings tab and enter your Google Gemini or OpenAI API key to enable AI Insights. d. Navigate to a failed batch in the AEP UI and click the (now hyperlinked) Batch ID. e. The extension popup will open to the Batch Inspector tab with your results. Your credentials and data are secure. - Adobe I/O Credentials: Stored only on your local computer using chrome.storage.local. They are never transmitted to any server except Adobe's. - AI API Keys (Gemini, OpenAI): Stored only on your local computer. They are sent directly from your browser to Google or OpenAI when you request an analysis. - Built-in AI Proxy: When using the built-in AI mode (no personal API key), your questions and Launch configuration are routed through our secure Google Cloud proxy to Google Gemini. No payload data is stored on the proxy ? only an anonymous usage count for rate limiting. - Subscription Verification: Payment status is verified server-side via Stripe to enforce usage limits securely. No payment details are accessible to the extension. - No Unnecessary Data Collection: This extension does not collect or transmit your browsing data, event data, or credentials to any third-party server beyond the services you explicitly initiate (Adobe APIs, AI providers, and the built-in proxy for subscriber AI requests).