
nlgdemkdapolikbjimjajpmonpbpmipk


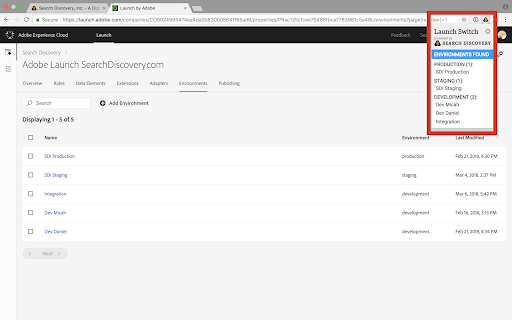
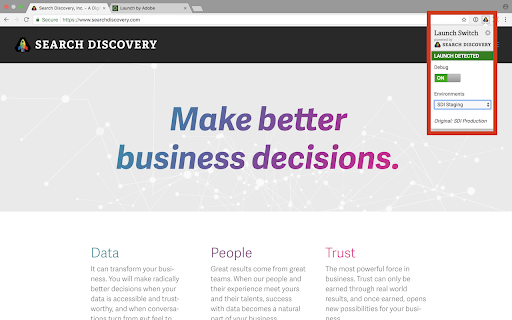
Enables the developer to locally override the embedded Launch or DTM library for testing. Allows environment selection and debug toggling for DTM and Launch, by Adobe. This handy extension from the analytics team at Search Discovery allows you to select environments for Adobe Launch and to toggle the debug and staging mode for Adobe Dynamic Tag Management. The debug mode tells the DTM or Launch library to add application messaging to the console. The staging mode for DTM uses the staging library instead of the production library. For sites using Adobe Launch, the switch allows easy switching of environments within a property. Once installed, an icon will appear in the address bar when a site has Adobe Launch or DTM installed. Click on the icon to expose the control panel. Notice of anonymous usage tracking: This extension tracks anonymous usage data. This data helps us understand usage patterns in order to provide a better product. We track interactions within this extension and nothing else. If you would like to opt out of this tracking, just press the gear icon in the upper right of any panel and click “No.” v2.0.12 Update Notes - Another Fix for "Record Environments" functionality ("x-gw-ims-org-id" is now a required header for Launch API) v2.0.11 Update Notes - Fix for "Record Environments" functionality v2.0.10 Update Notes - Fixes for Adobe's new framing of Launch within experience.adobe.com v2.0.8 Update Notes - Support for 99 Environments per Launch Property (previously 25) v2.0.6 Update Notes - Added support for DTM linked launch properties - Added "Clear Environments" button on the settings tab - Allow for Launch debugging to be activated when no environments are recorded Our overhaul of this extension is part of Search Discovery’s larger commitment to the Launch, by Adobe platform and to our clients as they migrate. Find out more about Search Discovery’s solutions for Launch, by Adobe. Feedback : launch-switch-extension@searchdiscovery.com

ObservePoint Debugger
Troubleshoot analytics tags, variables, events, cookies, and more. Supports Adobe Analytics, Google Analytics, and thousands more. Now with GPC, Accessibility Scanning, and a dedicated Cookies tab! Easily audit page accessibility, and view, search, and manage all browser cookies—the perfect all-in-one replacement for niche debugging tools. Overview ObservePoint’s Debugger is a free Chrome Extension for troubleshooting analytics, marketing tags, cookies, and web accessibility directly in Chrome DevTools. It captures page-load and event-triggered requests, parsing them into a clean, human-readable format for easy debugging and compliance checks. Key Features 🔹Simulate GPC Signals Instantly: Validate and compare tag and cookie compliance with Global Privacy Control (GPC) enabled directly inside the extension, eliminating the need for separate browser plugins or manual header workarounds. 🔹Accessibility Testing: Instantly scan any page for WCAG compliance issues. Identify errors in color contrast, ARIA labels, heading structures, and more to ensure an inclusive user experience. 🔹Cookies Tab: Quickly inspect all browser cookies in one place—including those set by tags and scripts. Filter and sort by name, value, domain, path, and expiration to understand privacy implications. 🔹Tag Inspection: See exactly what data is being sent to your analytics and marketing platforms in real-time. Why Use ObservePoint The Debugger is the first step toward comprehensive governance of your digital properties. The full ObservePoint platform helps you: 🔹 Audit Accessibility: Scan entire domains for WCAG 2.1/2.2 compliance. 🔹 Monitor Data Accuracy: Scan pages or user flows to ensure tags fire correctly. 🔹 Protect Privacy: Identify and categorize cookies set by third-party scripts. 🔹 Test Pre-Release: Validate implementations in dev and staging environments. 🔹 Automate Quality: Get alerts when tracking, compliance, or critical paths fail. How It Works After installation, open Chrome DevTools → ObservePoint tab → Refresh the page. See which tags, cookies, and accessibility violations appear, including: 🔅 Accessibility Health: Details of WCAG errors and warnings. 🔅 Tag Details: Name (GA4, Adobe, OneTrust), Account ID, and Category. 🔅 Tag Performance Metrics: Status, Request Size, and Latency. 🔅 Cookie Intelligence: Expiration dates and source attribution. Click any item to view variables, decoded request data, or specific remediation guidance for accessibility errors. Export your findings as an Excel file for easy sharing. Get Started The ObservePoint Debugger is a powerful alternative to WASP, OmniBug, Accessibility Insights, or Tag Inspector. 1. Enable the extension under Chrome → More Tools → Extensions. 2. Open DevTools (Ctrl+Shift+I / Cmd+Opt+I). 3. Select the ObservePoint tab. 4. Refresh your page. For cookies and accessibility, no refresh is required. 5. Start debugging! By installing, you agree to the ObservePoint Terms of Service: https://www.observepoint.com/service-agreement/ Learn more: https://help.observepoint.com/en/articles/9113174-observepoint-debugger-chrome-extension

MiaProva
MiaProva facilitates organizational scale and visibility into optimization programs. This extension is for Adobe Target end users. MiaProva's Chrome Extension 2.2.0.2 Update Updated the colors of the icon to make it easier to see when the extension is on or off and improved the loading/unloading of the Chrome Extension MiaProva's Chrome Extension 2.1.0.2 Update: We've added support to copy and download the Adobe Target server calls (mbox calls) as well as the WebSDK network calls. This will be helpful as organizatations enhance their WebSDK use or migrate from at.js to the WebSDK. MiaProva's Chrome Extension 2.1.0.1 Update: Added support for sites that have site injectors and don't provide a URL to Adobe Target. MiaProva's Chrome Extension 2.1.0.0 Update: New Branding and Design. MiaProva's Chrome Extension 2.0.1.0 Update: Added additional support for older at.js versions and made some CSS tweaks. MiaProva's Chrome Extension 2.0.0.0 Update: - Support for Adobe's WebSDK and Adobe Target - New Network Panel exposing Adobe Target Server calls along with any WebSDK requests and search functionality - Highlighting of tested content areas when the VEC was used - Visibility into Response Tokens with each modification from an Adobe Target Activity - A feed into the MiaProva Blog - Updates to Profile retrieval based on the Adobe ECID and Client ID (when WebSDK is detected) Below is a small list of features by each MiaProva Chrome Extension tab. We also have more information available here: https://www.miaprova.com/blog/adobe-target-chrome-extension-brought-to-you-by-miaprova/. ACTIVITIES tab: Here, Adobe Target users can easily see what activities and experiences they are members of as they traverse their digital properties. They can also see what other activities are mapped to their Adobe Target ID, which is very helpful for understanding cross-test participation. Target users will also see the data communicated to Adobe Target and a response from Adobe with the order of activities and offers execution for QA purposes. MiaProva also makes the offer code available for easy consumption. The premium feature on the Activities tab is that MiaProva customers can access reporting for any live Adobe Target Activity managed within MiaProva. MiaProva users can also upload test screenshots to those tests within this tab. PROFILE tab: This tab gives Adobe Target users a window into what Profile Attributes and values are associated with their Adobe Target ID. This feature creates an incredible opportunity for Adobe Target users to become more familiar with what Profiles are and how to use them for their personalization efforts. You can view all of your attributes within this tab, add additional attributes (helpful for many reasons!), and edit any of your current non-user—profile attributes. ID tab: Users can quickly see and copy any visitor ID values used in their optimization efforts. We purposely put the mbox3rdPartyId or 1st party ID in the first spot to highlight this underutilized component, which allows Adobe Target users to coordinate tests across devices and use all the rich data available in internal databases. IDEAS tab: Premium Feature—MiaProva's Chrome Extension is directly linked to end-user MiaProva accounts. Users can add test ideas in the context of their site and research. MiaProva will communicate ideas submitted here to its Idea Board for voting and prioritization. Subscribers to new ideas will receive an email letting them know. REPORTS tab: Premium Feature - MiaProva customers can access their test results via MiaProva's Adobe I/O integration. MiaProva also provides lift and statistical confidence calculations and makes them available here. Thank you for checking out the MiaProva Chrome Extension. We would love any feedback, thoughts, or ideas you may have. Please contact us at support@miaprova.com, and we will respond immediately.

dataslayer
Debug and test tag management (Google Tag Manager, DTM, Tealium) and analytics implementations. dataslayer adds a panel to Chrome Developer Tools that monitors tag management data layers and displays changes in an easy-to-read, user-friendly format. Supported TMS/variables include: - Google Tag Manager dataLayer variable - Adobe Launch rules and data elements - Adobe DTM page load rules and detection - Tealium data layer - TagCommander data layer - custom data layers (any variable represented as a JavaScript object) dataslayer supports multiple data layers / GTM containers on a single page, including those in embedded iframes. dataslayer also decodes and displays tags (including pageviews, variables, and click events) from: - Google Analytics (including App + Web, Universal Analytics / analytics.js, dc.js, and ga.js) - Adobe Analytics / Omniture SiteCatalyst - Floodlight For feature requests and bug reports, please either use the 'Send Feedback' option in the Chrome Web Store or reach out directly to info@dataslayer.org Source lives at https://github.com/sean-adams/dataslayer if you'd like to contribute!

Google Analytics Debugger
Prints useful information to the JavaScript console by enabling the debug version of the Google Analytics Javascript. This extension loads the debug version of the Google Analytics Javascript for all sites you browse using Google Chrome. It prints useful information to the Javascript console. These messages include error messages and warnings which can tell you when your analytics tracking code is set up incorrectly. In addition, it provides a detailed breakdown of each tracking beacon sent to Google Analytics. To use this extension, You need to follow three steps: 1. Turn it on by clicking its icon to the right of the address bar. 2. Open the Chrome Javascript console to see the messages. On Windows and Linux, press Control-Shift-J. On Mac, press Command-Option-J. 3. Refresh the page you are on. By installing this extension, you agree to the Chrome Gallery Terms of Service at https://chrome.google.com/extensions/intl/en/gallery_tos.html You can ask questions about the plugin and report bugs at analytics-extensions@google.com