
gidnphnamcemailggkemcgclnjeeokaa

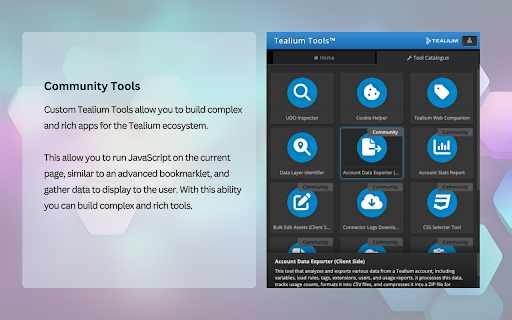


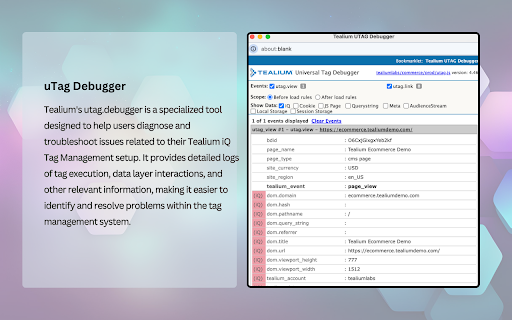
Evaluate website data, tags, and events with powerful tools for seamless Tealium iQ integration and server-side enrichments. Access quick links to documentation, training, and support, along with a catalog of custom tools built by the community. Improve your Tealium implementations with features like Web Companion for data layer validation, Server-side Trace for real-time action debugging, and Environment Switcher for seamless testing. Additional tools for troubleshooting, real-time interaction, and comprehensive testing ensure efficient, error-free setups. NEW FEATURES in V3: - New Side Panel Support - SSO Login - Click-and-Hold to Custom Sort - Built-in Feedback form 🔍 | Web Companion Easily inspect and validate your website's data layer, including cookies, JavaScript variables, and other critical elements. Fully integrated with Tealium iQ, Web Companion allows you to evaluate tags, extensions, and load rules directly on your web pages. 🎯 | Server-side Trace Monitor and debug your audience segmentation and real-time actions with Trace. Ensure the accuracy of visitor attributes, segment updates, and action firing to refine your digital marketing strategies. 🔄 | Environment Switcher Seamlessly switch between development, QA, and production environments within Tealium iQ to test and validate tags before deployment, ensuring error-free implementations across your digital properties. 🛠️ | uTag Debugger Diagnose and troubleshoot your Tealium iQ Tag Management setup with real-time logs that display tag execution and data layer interactions, ensuring accurate and efficient tag deployment. 💡 | Custom Tools Build complex and rich apps for the Tealium ecosystem. Custom tools allow you to run JavaScript on the current page, similar to an advanced bookmarklet, enabling you to gather data and create powerful, tailored tools for your specific needs. ➔ Real-Time Interaction: Make adjustments instantly with immediate feedback within your browser. ➔ User-friendly interface: Simplifies complex processes, making it accessible for both technical and non-technical users. ➔ Comprehensive Testing and Debugging: Provides tools for thorough testing and validation to ensure reliable performance and accurate data collection.

ObservePoint Debugger
Troubleshoot analytics tags, variables, events, cookies, and more. Supports Adobe Analytics, Google Analytics, and thousands more. Now with Accessibility Scanning and a dedicated Cookies tab! Easily audit page accessibility, and view, search, and manage all browser cookies—the perfect all-in-one replacement for niche debugging tools. Overview ObservePoint’s Debugger is a free Chrome Extension for troubleshooting analytics, marketing tags, cookies, and web accessibility directly in Chrome DevTools. It captures page-load and event-triggered requests, parsing them into a clean, human-readable format for easy debugging and compliance checks. Key Features 🔹NEW: Accessibility Tab: Instantly scan any page for WCAG compliance issues. Identify errors in color contrast, ARIA labels, heading structures, and more to ensure an inclusive user experience. 🔹Cookies Tab: Quickly inspect all browser cookies in one place—including those set by tags and scripts. Filter and sort by name, value, domain, path, and expiration to understand privacy implications. 🔹Tag Inspection: See exactly what data is being sent to your analytics and marketing platforms in real-time. Why Use ObservePoint The Debugger is the first step toward comprehensive governance of your digital properties. The full ObservePoint platform helps you: 🔹 Audit Accessibility: Scan entire domains for WCAG 2.1/2.2 compliance. 🔹 Monitor Data Accuracy: Scan pages or user flows to ensure tags fire correctly. 🔹 Protect Privacy: Identify and categorize cookies set by third-party scripts. 🔹 Test Pre-Release: Validate implementations in dev and staging environments. 🔹 Automate Quality: Get alerts when tracking, compliance, or critical paths fail. How It Works After installation, open Chrome DevTools → ObservePoint tab → Refresh the page. See which tags, cookies, and accessibility violations appear, including: 🔅 Accessibility Health: Details of WCAG errors and warnings. 🔅 Tag Details: Name (GA4, Adobe, OneTrust), Account ID, and Category. 🔅 Tag Performance Metrics: Status, Request Size, and Latency. 🔅 Cookie Intelligence: Expiration dates and source attribution. Click any item to view variables, decoded request data, or specific remediation guidance for accessibility errors. Export your findings as an Excel file for easy sharing. Get Started The ObservePoint Debugger is a powerful alternative to WASP, OmniBug, Accessibility Insights, or Tag Inspector. 1. Enable the extension under Chrome → More Tools → Extensions. 2. Open DevTools (Ctrl+Shift+I / Cmd+Opt+I). 3. Select the ObservePoint tab. 4. Refresh your page. For cookies and accessibility, no refresh is required. 5. Start debugging! By installing, you agree to the ObservePoint Terms of Service: https://www.observepoint.com/service-agreement/ Learn more: https://help.observepoint.com/en/articles/9113174-observepoint-debugger-chrome-extension

Launch and DTM Switch
Enables the developer to locally override the embedded Launch or DTM library for testing. Allows environment selection and debug toggling for DTM and Launch, by Adobe. This handy extension from the analytics team at Search Discovery allows you to select environments for Adobe Launch and to toggle the debug and staging mode for Adobe Dynamic Tag Management. The debug mode tells the DTM or Launch library to add application messaging to the console. The staging mode for DTM uses the staging library instead of the production library. For sites using Adobe Launch, the switch allows easy switching of environments within a property. Once installed, an icon will appear in the address bar when a site has Adobe Launch or DTM installed. Click on the icon to expose the control panel. Notice of anonymous usage tracking: This extension tracks anonymous usage data. This data helps us understand usage patterns in order to provide a better product. We track interactions within this extension and nothing else. If you would like to opt out of this tracking, just press the gear icon in the upper right of any panel and click “No.” v2.0.12 Update Notes - Another Fix for "Record Environments" functionality ("x-gw-ims-org-id" is now a required header for Launch API) v2.0.11 Update Notes - Fix for "Record Environments" functionality v2.0.10 Update Notes - Fixes for Adobe's new framing of Launch within experience.adobe.com v2.0.8 Update Notes - Support for 99 Environments per Launch Property (previously 25) v2.0.6 Update Notes - Added support for DTM linked launch properties - Added "Clear Environments" button on the settings tab - Allow for Launch debugging to be activated when no environments are recorded Our overhaul of this extension is part of Search Discovery’s larger commitment to the Launch, by Adobe platform and to our clients as they migrate. Find out more about Search Discovery’s solutions for Launch, by Adobe. Feedback : launch-switch-extension@searchdiscovery.com

Ensighten Developer Tools (Deprecated)
*** This extension is now deprecated due to the integration into CHEQ and also owing to Chrome extensions moving to MV3. Please install the new CHEQ Developer Tools extension to continue using this extension tool-set: The Ensighten Developer Tools extension adds functionality to modify content loaded from the Ensighten system on websites. Users are able to change which account is loaded on an existing page, remove Ensighten from pages, or add Ensighten to new pages on their local machine. As of 2021 this extension will also feature the Privacy Inspector feature that allows the user to inspect request and consent data linked to the Ensighten Privacy solution. It also saw the addition of the Privacy Audit feature which allows the user to audit any web page to check for client-side vulnerabilities. As of 2022 the server-side tagging explorer was added to allow the user to inspect their SST implementation and debug how tags are perfoming server-side in real-time.

MiaProva
MiaProva facilitates organizational scale and visibility into optimization programs. This extension is for Adobe Target end users. MiaProva's Chrome Extension 2.2.0.2 Update Updated the colors of the icon to make it easier to see when the extension is on or off and improved the loading/unloading of the Chrome Extension MiaProva's Chrome Extension 2.1.0.2 Update: We've added support to copy and download the Adobe Target server calls (mbox calls) as well as the WebSDK network calls. This will be helpful as organizatations enhance their WebSDK use or migrate from at.js to the WebSDK. MiaProva's Chrome Extension 2.1.0.1 Update: Added support for sites that have site injectors and don't provide a URL to Adobe Target. MiaProva's Chrome Extension 2.1.0.0 Update: New Branding and Design. MiaProva's Chrome Extension 2.0.1.0 Update: Added additional support for older at.js versions and made some CSS tweaks. MiaProva's Chrome Extension 2.0.0.0 Update: - Support for Adobe's WebSDK and Adobe Target - New Network Panel exposing Adobe Target Server calls along with any WebSDK requests and search functionality - Highlighting of tested content areas when the VEC was used - Visibility into Response Tokens with each modification from an Adobe Target Activity - A feed into the MiaProva Blog - Updates to Profile retrieval based on the Adobe ECID and Client ID (when WebSDK is detected) Below is a small list of features by each MiaProva Chrome Extension tab. We also have more information available here: https://www.miaprova.com/blog/adobe-target-chrome-extension-brought-to-you-by-miaprova/. ACTIVITIES tab: Here, Adobe Target users can easily see what activities and experiences they are members of as they traverse their digital properties. They can also see what other activities are mapped to their Adobe Target ID, which is very helpful for understanding cross-test participation. Target users will also see the data communicated to Adobe Target and a response from Adobe with the order of activities and offers execution for QA purposes. MiaProva also makes the offer code available for easy consumption. The premium feature on the Activities tab is that MiaProva customers can access reporting for any live Adobe Target Activity managed within MiaProva. MiaProva users can also upload test screenshots to those tests within this tab. PROFILE tab: This tab gives Adobe Target users a window into what Profile Attributes and values are associated with their Adobe Target ID. This feature creates an incredible opportunity for Adobe Target users to become more familiar with what Profiles are and how to use them for their personalization efforts. You can view all of your attributes within this tab, add additional attributes (helpful for many reasons!), and edit any of your current non-user—profile attributes. ID tab: Users can quickly see and copy any visitor ID values used in their optimization efforts. We purposely put the mbox3rdPartyId or 1st party ID in the first spot to highlight this underutilized component, which allows Adobe Target users to coordinate tests across devices and use all the rich data available in internal databases. IDEAS tab: Premium Feature—MiaProva's Chrome Extension is directly linked to end-user MiaProva accounts. Users can add test ideas in the context of their site and research. MiaProva will communicate ideas submitted here to its Idea Board for voting and prioritization. Subscribers to new ideas will receive an email letting them know. REPORTS tab: Premium Feature - MiaProva customers can access their test results via MiaProva's Adobe I/O integration. MiaProva also provides lift and statistical confidence calculations and makes them available here. Thank you for checking out the MiaProva Chrome Extension. We would love any feedback, thoughts, or ideas you may have. Please contact us at support@miaprova.com, and we will respond immediately.