
bdingoflfadhnjohjaplginnpjeclmof

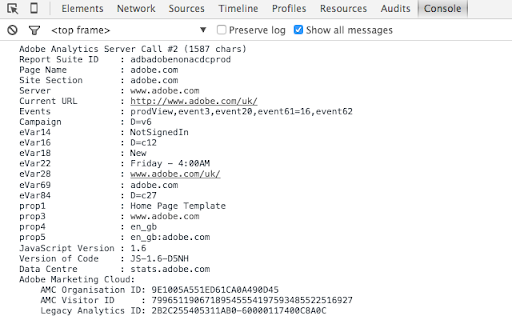
Adobe Analytics Debugger for POST and GET requests. Prints following info: - displays all page load data, link events, file downloads - shows information about data collection servers and informs if it is an RDC server or not - provides recommendations on how to improve the implementation - displays Adobe Marketing Cloud visitor ID and Adobe Marketing Cloud organisation ID

Ensighten Developer Tools (Deprecated)
*** This extension is now deprecated due to the integration into CHEQ and also owing to Chrome extensions moving to MV3. Please install the new CHEQ Developer Tools extension to continue using this extension tool-set: The Ensighten Developer Tools extension adds functionality to modify content loaded from the Ensighten system on websites. Users are able to change which account is loaded on an existing page, remove Ensighten from pages, or add Ensighten to new pages on their local machine. As of 2021 this extension will also feature the Privacy Inspector feature that allows the user to inspect request and consent data linked to the Ensighten Privacy solution. It also saw the addition of the Privacy Audit feature which allows the user to audit any web page to check for client-side vulnerabilities. As of 2022 the server-side tagging explorer was added to allow the user to inspect their SST implementation and debug how tags are perfoming server-side in real-time.

Universal Adobe Debugger
Universal Adobe Debugger is a powerful Chrome extension for debugging Adobe Analytics, Adobe Experience Platform (AEP), Adobe Web SDK, and Adobe Launch (Tags) implementations. Built by analysts for analysts, this tool helps you validate tracking, inspect payloads, and troubleshoot Adobe Experience Cloud integrations directly from the browser console. Simply open DevTools and trigger Adobe Analytics or Web SDK calls to instantly view structured, readable debugging output. Log and inspect Adobe Analytics server calls (AppMeasurement, s.t, s.tl) directly in the console for faster troubleshooting and QA validation. Access rule execution details and implementation diagnostics to verify Launch configurations with ease. Monitor Adobe Experience Platform Web SDK requests and XDM payloads with clean, formatted console output — no more digging through nested objects. Replace Adobe Launch libraries seamlessly to test and validate implementations in real time. Access a curated collection of debugging snippets for analytics validation and consent troubleshooting. Verify Adobe Launch rules and data layer mappings Improve tracking accuracy and data quality Streamline QA workflows for analysts and developers Whether you're an Adobe Analytics specialist, AEP implementer, Launch developer, or digital analyst, Universal Adobe Debugger helps you debug smarter and ship cleaner data. Found a bug or have a feature request? Contributions and feedback are welcome. Visit our GitHub repository at https://github.com/cthae/Adobe-Launch-Debugger to report issues or suggest improvements. Changelog: 2025-04-06 -> 1.25 * [x] Add an option to disable displaying of the Target "decisioning" web sdk requests. To reduce clutter. * [x] Identify "decisioning" web sdk requests as Target rather than PV. Correct the call name. 2025-03-30 -> 1.24 * [x] Add a color picker set of settings that would allow users configure the colors of console printouts. * [x] Make a snippet shortcut to delete all cookies and local storage present on the active tab. * [x] Make OT printouts not fuzzy again. 2025-03-09 -> 1.23 * [x] CSS refactory * [x] Better bookmarks design * [x] Add an option for the light mode for the extension's UI. * [x] _satellite decided to become touchy about setDebug() using a truthy arg. Replace 1 with true. 2024-12-10 -> 1.22 * [x] Reimplementation of Adobe Experience Cloud Bookmarks * [x] Rename tabs to icons * [x] Move the redirects tab to somewhere else. To Settings and Home probably * [x] Make a New Tab for bookmarks * [x] Add a setting to choose the tab that would be opened by default when the popup renders (Home/Settings/Bookmarks) * [x] Clean up redirections. Add a message for when there's no redirections yet. 2024-11-08 -> 1.21 * [x] Change the extension icon depending on the env: * grey for when the extension hasn't yet executed all code or doesn't have the permission to do so; * green indicates that the Launch env is production; * yellow indicates that the Launch env is dev or staging; * red indicates that the Launch library is not loaded or loaded incompletely. Basically, _satellite?.environment?.stage is falsy. The rest of the functionality won't be stopped by this, however. * [x] Update the extension icon. * [x] Disable Launch UI improvements on by default. * [x] Multiple small bugfixes and refactories. 2024-10-04 -> 1.20 * [x] Add onInstalled/onStartup callbacks to set the default set of settings specifically for those who don't open the popup after installation. * [x] Support for Mozilla FF. Same extension. Cross-browsers. Seems like mostly only background will have to be reimplemented, but many APIs may be off. We'll see. 2024-10-01 -> 1.10 * [x] Appmeasurement: Prettify the product string printing. * [x] Appmeasurement: Add transaction id in the product string prettifier. * [x] Implement Launch UI improvements POC: * [x] Launch UI: Add the red indicator whenever a lib is not selected. * [x] Launch UI: Add a hint about how to change the Launch UI via Chrome flags. * [x] Add an option to print general alloy config in the snippets tab. Make sure it does so for all Alloy instances. 2024-09-02 -> 1.09.1 * [x] Rename the content-script.js to something more interesting. It's visible in the console and can be filtered by. * [x] Web SDK: Further improve the custom logging, allowing shorthands: p12/c12/v12/e12/l2. * [x] Apply all the shorthanded custom logging to Appmeasurement logging too. 2024-08-26 -> 1.09.1 * [x] Fix a bug in custom logging, in event shortcuts for the data.__adobe.analytics usecases. * [x] Fix a bug in custom logging, in prop shortcuts for the data.__adobe.analytics usecases. 2024-08-25 -> 1.09: * [x] Web SDK: Expose the event type in the logging header. * [x] Web SDK: Improve the custom logger to also check the data.__adobe.analytics object when using shortcuts. * [x] Web SDK: Make it easier for non-technical people to use the custom logging: don't require them to specify the full path to evars, props or events for xdm payloads. If users ask for evars and it's an xdm event, just add the correct path to it. * [x] Reimplement page load time to something like performance.getEntriesByType("navigation")[0]?.duration 2024-08-20 -> 1.08.1: * [x] Increased the delay at which the response is no longer expected to six seconds. Because AA can be very slow to respond. 2024-08-18 -> 1.08: * [x] Web SDK: On errors, in custom logs, add an indication that the request resulted in an error. This is for people who use filters in the console like pros. Thanks Arun for noticing. * [x] Web SDK: MVP tracking the navigator.sendBeacon() ping network requests. No access to their payloads, however, because the Chrome devteam neglects fixing related bugs. * [x] Delete requests from the map on other callbacks too to avoid misreporting calls as such that didn't receive the server response. 2024-08-14 -> 1.07.01: * [x] Increased the delay at which the response is no longer expected to two seconds. * [x] Cleanup. 2024-08-13 -> 1.07: * [x] Print the extension version, getting it from the manifest. * [x] UX improvements, CSS fixes. * [x] Add a bug submission button in info. * [x] Web SDK: Add an option to log all fields there are, giving the user the raw object. * [x] Add a callback and error logging for "cancelled" requests. That's when the browser cancels the request. And a few other types of requests. Thanks to Arun for the suggestion. * [x] Web SDK: Apply the error logging logic to Web SDK tracking too * [x] Small popup UI improvements. 2024-06-02 -> 1.06 - Byanka: * [x] Replace the counter of PVs and links with AA calls and WebSDK calls * [x] Web SDK: Improve autodebugging: indicate when linkClicks will be treated as pageviews in AA due to the web fields set. * [x] Web SDK: Surface the Edge config ids for every request, make them visible just like AA Report Suites. To ease the debugging of multi-destinational tracking. First 5 characters should suffice. * [x] Web SDK: Improve the tracking of network errors when edge network requests fail. * [x] Web SDK: Refactor logging. Make it less confusing. No more nested groups. * [x] Web SDK: Change the default logging a bit to maybe try and expand the analytics object automatically. * [x] Web SDK: Add a setting to remove the essentially useless xdm fields that are rarely useful to look at. On by default. * [x] Web SDK: Improve the logging for non-object fields. * [x] Web SDK: Add logging for the data.__adobe object. Off by default in settings. * [x] Web SDK: Reinforce the custom logging field, allow people to use the xdm. reference in the list of params. For older versions, please refer to github releases here: https://github.com/cthae/Adobe-Launch-Debugger/releases

Tealium Tools
Evaluate website data, tags, and events with powerful tools for seamless Tealium iQ integration and server-side enrichments. Access quick links to documentation, training, and support, along with a catalog of custom tools built by the community. Improve your Tealium implementations with features like Web Companion for data layer validation, Server-side Trace for real-time action debugging, and Environment Switcher for seamless testing. Additional tools for troubleshooting, real-time interaction, and comprehensive testing ensure efficient, error-free setups. NEW FEATURES in V3: - New Side Panel Support - SSO Login - Click-and-Hold to Custom Sort - Built-in Feedback form 🔍 | Web Companion Easily inspect and validate your website's data layer, including cookies, JavaScript variables, and other critical elements. Fully integrated with Tealium iQ, Web Companion allows you to evaluate tags, extensions, and load rules directly on your web pages. 🎯 | Server-side Trace Monitor and debug your audience segmentation and real-time actions with Trace. Ensure the accuracy of visitor attributes, segment updates, and action firing to refine your digital marketing strategies. 🔄 | Environment Switcher Seamlessly switch between development, QA, and production environments within Tealium iQ to test and validate tags before deployment, ensuring error-free implementations across your digital properties. 🛠️ | uTag Debugger Diagnose and troubleshoot your Tealium iQ Tag Management setup with real-time logs that display tag execution and data layer interactions, ensuring accurate and efficient tag deployment. 💡 | Custom Tools Build complex and rich apps for the Tealium ecosystem. Custom tools allow you to run JavaScript on the current page, similar to an advanced bookmarklet, enabling you to gather data and create powerful, tailored tools for your specific needs. ➔ Real-Time Interaction: Make adjustments instantly with immediate feedback within your browser. ➔ User-friendly interface: Simplifies complex processes, making it accessible for both technical and non-technical users. ➔ Comprehensive Testing and Debugging: Provides tools for thorough testing and validation to ensure reliable performance and accurate data collection.

MiaProva
MiaProva facilitates organizational scale and visibility into optimization programs. This extension is for Adobe Target end users. MiaProva's Chrome Extension 2.2.0.2 Update Updated the colors of the icon to make it easier to see when the extension is on or off and improved the loading/unloading of the Chrome Extension MiaProva's Chrome Extension 2.1.0.2 Update: We've added support to copy and download the Adobe Target server calls (mbox calls) as well as the WebSDK network calls. This will be helpful as organizatations enhance their WebSDK use or migrate from at.js to the WebSDK. MiaProva's Chrome Extension 2.1.0.1 Update: Added support for sites that have site injectors and don't provide a URL to Adobe Target. MiaProva's Chrome Extension 2.1.0.0 Update: New Branding and Design. MiaProva's Chrome Extension 2.0.1.0 Update: Added additional support for older at.js versions and made some CSS tweaks. MiaProva's Chrome Extension 2.0.0.0 Update: - Support for Adobe's WebSDK and Adobe Target - New Network Panel exposing Adobe Target Server calls along with any WebSDK requests and search functionality - Highlighting of tested content areas when the VEC was used - Visibility into Response Tokens with each modification from an Adobe Target Activity - A feed into the MiaProva Blog - Updates to Profile retrieval based on the Adobe ECID and Client ID (when WebSDK is detected) Below is a small list of features by each MiaProva Chrome Extension tab. We also have more information available here: https://www.miaprova.com/blog/adobe-target-chrome-extension-brought-to-you-by-miaprova/. ACTIVITIES tab: Here, Adobe Target users can easily see what activities and experiences they are members of as they traverse their digital properties. They can also see what other activities are mapped to their Adobe Target ID, which is very helpful for understanding cross-test participation. Target users will also see the data communicated to Adobe Target and a response from Adobe with the order of activities and offers execution for QA purposes. MiaProva also makes the offer code available for easy consumption. The premium feature on the Activities tab is that MiaProva customers can access reporting for any live Adobe Target Activity managed within MiaProva. MiaProva users can also upload test screenshots to those tests within this tab. PROFILE tab: This tab gives Adobe Target users a window into what Profile Attributes and values are associated with their Adobe Target ID. This feature creates an incredible opportunity for Adobe Target users to become more familiar with what Profiles are and how to use them for their personalization efforts. You can view all of your attributes within this tab, add additional attributes (helpful for many reasons!), and edit any of your current non-user—profile attributes. ID tab: Users can quickly see and copy any visitor ID values used in their optimization efforts. We purposely put the mbox3rdPartyId or 1st party ID in the first spot to highlight this underutilized component, which allows Adobe Target users to coordinate tests across devices and use all the rich data available in internal databases. IDEAS tab: Premium Feature—MiaProva's Chrome Extension is directly linked to end-user MiaProva accounts. Users can add test ideas in the context of their site and research. MiaProva will communicate ideas submitted here to its Idea Board for voting and prioritization. Subscribers to new ideas will receive an email letting them know. REPORTS tab: Premium Feature - MiaProva customers can access their test results via MiaProva's Adobe I/O integration. MiaProva also provides lift and statistical confidence calculations and makes them available here. Thank you for checking out the MiaProva Chrome Extension. We would love any feedback, thoughts, or ideas you may have. Please contact us at support@miaprova.com, and we will respond immediately.