
niiahgnkkalkindhghjcaojcpbkhfbbp

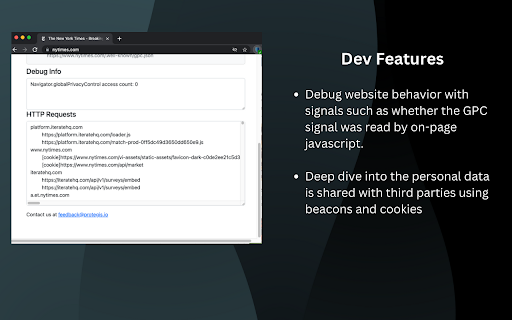
This GPC Chrome Extension enables the Global Privacy Control opt-out signal and evaluates how websites respond to the setting This Global Privacy Control Chrome Extension enables the GPC setting and evaluates whether whether websites honor the opt-out setting by providing transparency into the personal data shared with third parties. The right for website visitors to opt-out of the sale of personal information is a hallmark of data privacy laws such as the California Consumer Privacy Act (CCPA). Regulators are accelerating enforcement against companies that do not honor the Global Privacy Control (GPC) signal as a valid opt-out. "Under law, [GPC] must be honored by covered businesses as a valid consumer request to stop the sale of personal information." https://oag.ca.gov/privacy/ccpa" For developers and IT teams, this extension helps understand and debug how webpages respond to the GPC signal. Diagnostic capabilities include: - Validate the GPC signal was set and the website response is consistent with the GPC specification - Diagnose website behavior including whether the GPC signal was read by the page - Debug whether personal data is shared by examining information provided to third parties using beacons and cookies. Questions? Feedback? We'd love to hear from you at contact@protegis.io

Adswerve - dataLayer Inspector+
DataLayer Tools for Digital Analysts The Adswerve dataLayer Inspector+ is a tool kit of utilities for a digital analyst. Inspect Google Analytics activity - Monitor the dataLayer in real time - See the Google Analytics hits in the console, as they happen - Evaluate common dataLayer pushes formats: events and ecommerce Insert additional resources in the page - Push a dataLayer message for setup - Add a GTM container to test it - Insert code into the page to monitor and modify How to use the dataLayer Inspector+: https://adswerve.com/resources/adswerve-data-layer-inspector-2 Update for v2024.11.1.1 Due to new restrictions on external script tags in Chrome extensions, the "Insert GTM Container" option has been removed from dataLayer Inspector+. Follow these steps to insert a GTM container into a web page with the "Inject Code" feature instead: Go to tagmanager.google.com. Under the Admin tab for your container, select "Install Google Tag Manager." As shown in the screenshot below, where it says "Paste this code as high in the of the page as possible," copy just the snippet code content. Note: Do not include , only the code between them. In the DataLayer Inspector popup, under "Add Functionality," check "Inject Code." Paste the code snippet from Tag Manager into the text box that appears. Click the button to "Save Settings & Reload." The GTM container will be inserted until the "Inject Code" box is unchecked and "Save Settings & Reload" is clicked again. Be sure to do this when you've finished testing.

Tag Explorer
Tag Explorer is designed to simplify and enhance your tag monitoring process. With Tag Explorer, you can easily: ○ Visualize: Tag Explorer provides a comprehensive view of tags on a webpage using the extensive tag library of Tag Inspector, its parent product ○ Analyze: Dive deep into the data collected by each tag and quickly determine what information is being sent about your users ○ Detect: Easily search for and resolve tag-related issues quickly to ensure your data is accurate and actionable Tag Explorer is your go-to tool for understanding and controlling your digital ecosystem with ease. ** Want to see all tags on your site quickly, and on more than just one page? Check out Tag Inspector and request a free enterprise scan! ** Need help with Google Consent Mode? Check out our other extension, "Consent Mode Inspector"!

Analytics Debugger
Your Single Source of Truth (SSOT) for debugging analytics implementations Formerly known as "GTM/GA Debugger," our tool is your ultimate Single Source of Truth (SSOT) for debugging analytics implementations! Are you a developer, analyst, or marketer committed to achieving top-tier web analytics and tracking results? Look no further! Our powerful debug tool is meticulously crafted to simplify your life. Analytics Debugger streamlines your daily debugging tasks, boasting user-friendliness for all while delivering in-depth insights to advanced users. v2.4.6 - Adds support for Chartbeat - Fixed Amplitude Regional Collection Endpoints 🛠️ Wide Compatibility: Our tool seamlessly supports a variety of analytics and tracking tools, including: - Google Tag Manager - Google Analytics - Tealium - Piwik Pro / Matomo - Adobe tools - and most commonly used Marketing Pixels. to mention some of them (Check the full list here) 🔒 Privacy Enhancement: Rest assured, our tool injects code only after DevTools has loaded, with no background monitoring. 🚀 Tools: Supercharge your tracking implementation with a rich toolkit including - GTM Preview Enhancer: USe this tool to bypass all the limitations from the original Preview Mode - Google Analytics Debug Libraries Loader - Block GA3/GA4 Hits: Prevent your - Export Features - Real-Time Data - Enhanced Ecommerce Reports - Data Filtering for Focused Insights - Clicks Blocker: Prevent being redirected to next page - and much more! Get started today and elevate your analytics debugging and optimization process effortlessly. Unlock the full potential of your analytics and tracking endeavors – streamline your workflow, enhance privacy, and gain profound insights seamlessly. Download now and experience the transformation! Changelog: You can check out our latest updates on our GitHub repository. https://github.com/analytics-debugger/analytics-debugger-browser-extension Support / Feedback: Offered via the Store or using the Github Repository Official Documentation: For detailed guidance, visit our official documentation at https://www.analytics-debugger.com/tools/browser-extension Don't miss out on this game-changing tool. Elevate your analytics game today!

ObservePoint Debugger
Troubleshoot analytics tags, variables, events, cookies, and more. Supports Adobe Analytics, Google Analytics, and thousands more. Now with GPC, Accessibility Scanning, and a dedicated Cookies tab! Easily audit page accessibility, and view, search, and manage all browser cookies—the perfect all-in-one replacement for niche debugging tools. Overview ObservePoint’s Debugger is a free Chrome Extension for troubleshooting analytics, marketing tags, cookies, and web accessibility directly in Chrome DevTools. It captures page-load and event-triggered requests, parsing them into a clean, human-readable format for easy debugging and compliance checks. Key Features 🔹Simulate GPC Signals Instantly: Validate and compare tag and cookie compliance with Global Privacy Control (GPC) enabled directly inside the extension, eliminating the need for separate browser plugins or manual header workarounds. 🔹Accessibility Testing: Instantly scan any page for WCAG compliance issues. Identify errors in color contrast, ARIA labels, heading structures, and more to ensure an inclusive user experience. 🔹Cookies Tab: Quickly inspect all browser cookies in one place—including those set by tags and scripts. Filter and sort by name, value, domain, path, and expiration to understand privacy implications. 🔹Tag Inspection: See exactly what data is being sent to your analytics and marketing platforms in real-time. Why Use ObservePoint The Debugger is the first step toward comprehensive governance of your digital properties. The full ObservePoint platform helps you: 🔹 Audit Accessibility: Scan entire domains for WCAG 2.1/2.2 compliance. 🔹 Monitor Data Accuracy: Scan pages or user flows to ensure tags fire correctly. 🔹 Protect Privacy: Identify and categorize cookies set by third-party scripts. 🔹 Test Pre-Release: Validate implementations in dev and staging environments. 🔹 Automate Quality: Get alerts when tracking, compliance, or critical paths fail. How It Works After installation, open Chrome DevTools → ObservePoint tab → Refresh the page. See which tags, cookies, and accessibility violations appear, including: 🔅 Accessibility Health: Details of WCAG errors and warnings. 🔅 Tag Details: Name (GA4, Adobe, OneTrust), Account ID, and Category. 🔅 Tag Performance Metrics: Status, Request Size, and Latency. 🔅 Cookie Intelligence: Expiration dates and source attribution. Click any item to view variables, decoded request data, or specific remediation guidance for accessibility errors. Export your findings as an Excel file for easy sharing. Get Started The ObservePoint Debugger is a powerful alternative to WASP, OmniBug, Accessibility Insights, or Tag Inspector. 1. Enable the extension under Chrome → More Tools → Extensions. 2. Open DevTools (Ctrl+Shift+I / Cmd+Opt+I). 3. Select the ObservePoint tab. 4. Refresh your page. For cookies and accessibility, no refresh is required. 5. Start debugging! By installing, you agree to the ObservePoint Terms of Service: https://www.observepoint.com/service-agreement/ Learn more: https://help.observepoint.com/en/articles/9113174-observepoint-debugger-chrome-extension