
lpnefmcndcepmmmankbeeonlobkhlmnh


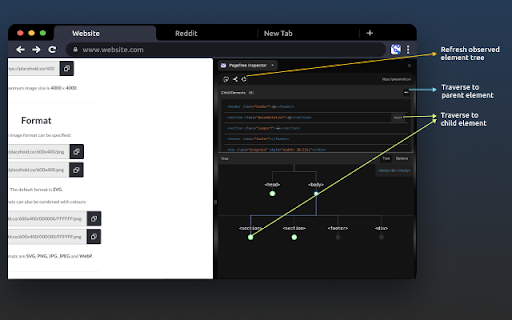
Visualize distribution of DOM nodes in the document tree Visualize the distribution of DOM element nodes within the document tree of any web page. You have the ability to generate interactive tree views for any element, just like inspecting an element using the DevTools element inspector. 🌳 Visualize Document Trees: See the organization of DOM nodes in any web page through an interactive tree representations. 🌚 Dark Mode: Reduce eye strain during late-night sessions with our Dark Mode option for a more comfortable experience. 👆Interactive Navigation: Easily traverse parent, child, and sibling nodes within the DOM tree to grasp relationships. 🔄 Observable Updates: Keep up with document tree changes by refreshing and instantly viewing updates. 🌐 Customize Orientation: Tailor your visualization to your preference with horizontal or vertical tree orientations. ✒️ Path Rendering Options: Choose from various path rendering styles – diagonal, straight, elbow, or step – for a customized look.

Elements Inspektor
Elemets Inspektor! Unleash the full potential of web development with Elements Inspector! This robust Chrome extension empowers you… Elemets Inspektor! Unleash the full potential of web development with Elements Inspector! This robust Chrome extension empowers you to easily inspect various elements on any webpage. Designed for precision and ease, Elements Inspector delivers accurate measurements of an element's height, width, font size, and font family, all with just a simple shift + click. Ideal for developers, designers, and anyone in need of detailed web page analysis, Elements Inspector eliminates the guesswork in your tasks. Just press shift + click to mark an element, and all its details will be displayed. If your element contains text, you'll also see the font size and font family. And for a clutter-free workspace, simply click the element again to clear all markings and measurements. Upgrade your web development toolkit today with Elements Inspector. Experience the seamless, straightforward approach to web inspection, tailored to save you time and boost your productivity. Note: While Elements Inspector is designed to work with all websites, its functionality may vary depending on the structure of individual pages. To ensure an undisturbed browsing experience, the extension operates only when activated. What's New: Introduction of font size and font family inspection features. Reach out to our dedicated support team if you have any queries or need assistance. Happy inspecting with Elements Inspector!

dom3d
View the DOM in 3D.

Attribute Reporter
Dev Tools Extension to report on elements attributes and copy their value as text or xpath expression Attribute Reporter is a DevTools panel for inspecting HTML element attributes across a page. Select any element, type an attribute name (or pick class, id, or data-testid with one click), and instantly see a list of all matching child elements with their values — or which ones are missing them. - 🔍 Inspect any attribute by name across all child elements - ✅ Spot missing or empty attribute values at a glance - 📋 Copy individual values, XPath expressions, or CSS selectors to the clipboard - 📦 Export all results as JSON (element, value, CSS selector, XPath) - 🔒 No special permissions required What's New in v2.1.0 - 🔍 Missing attribute finder — Toggle "∅ missing" to instantly see all elements that lack the target attribute (e.g. buttons without aria-label). - 🏷️ Element-type filter — Filter results by element type (button, input, div…). Multi-select, composes with the missing toggle. - 🟢🟡🟠🔴 Status indicators — Every row now shows a color-coded status: OK, duplicate value, empty value, or missing attribute. Hover for details. - 📋 Copy as CSV — Export the current filtered list as CSV, ready for spreadsheets or bug reports. - 💾 Remembers your last attribute — The target attribute name is now saved between DevTools sessions. - aria-label shortcut added to the quick-select badges.

DOM Structure Visualizer
DOM Structure Visualizer - Instantly See the DOM Tree Ever struggled to understand how elements are nested on a web page? DOM Structure Visualizer makes it effortless. Simply hover over any element, and the extension instantly highlights its parent elements, direct children, and the element itself, all with distinct, color-coded outlines and informative labels. • 🖱️ Hover to Visualize — Move your cursor over any element to instantly see its position in the DOM hierarchy. No clicking, no inspecting, no dev tools required. • 🎨 Color-Coded Highlights — Hovered elements, parents, and children each get their own distinct color, making it easy to understand nesting at a glance. • 🏷️ Smart Labels — Floating labels show each element's tag name, ID, classes, and dimensions. Toggle them on or off as needed. • 🎨 4 Color Schemes — Choose from Default, Neon, High Contrast, or fully Custom colors. The Custom theme lets you pick exact colors using HEX codes, RGB values, or a color picker. • ⚙️ Full Settings Page — Access advanced settings through the gear icon or your browser's extension options. Includes a live preview so you can see your color choices in real time. • 🌍 50+ Languages — Fully localized interface supporting over 50 languages including English, Spanish, French, German, Japanese, Chinese, Arabic, Hindi, and many more. • ⚡ Performance-First — Uses requestAnimationFrame, event throttling, and minimal DOM manipulation. Designed to run smoothly even on complex pages. • 🔒 100% Private — Zero data collection. No analytics, no tracking, no network requests. Everything runs locally in your browser. Verify it yourself — the source code is fully open. 🎯 PERFECT FOR • Web developers debugging layout and structure issues • Students learning HTML and CSS • Designers inspecting how pages are built • QA testers verifying DOM structure • Anyone curious about how websites are constructed DOM Structure Visualizer is completely open source under the MIT License. It requests only the minimum permissions needed (activeTab and storage). It makes zero network requests — ever. Your browsing data never leaves your device. 1. Click the extension icon in your toolbar 2. Toggle the visualizer ON 3. Hover over any element on the page 4. See the DOM hierarchy highlighted instantly 5. Adjust settings to your preference This extension is free, open source, and community-driven. Contributions, bug reports, and feature requests are welcome on GitHub: https://github.com/e8013585/dom-structure-visualizer If you find DOM Structure Visualizer useful, please consider leaving a rating ⭐ — it helps others discover the extension. Thank you!