
dcbebomificokapbopjhihlhjobeincb
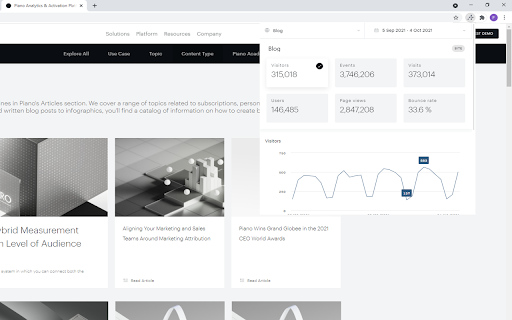


In-Page Piano Analytics The In-Page Piano Analytics extension allows you to analyse your website’s traffic directly within the browser's active page. You can use the popup view or the Chrome DevTools view (F12) in order to keep the display during navigation. You need a valid Piano Analytics account to use it.

Analytics Debugger
Your Single Source of Truth (SSOT) for debugging analytics implementations Formerly known as "GTM/GA Debugger," our tool is your ultimate Single Source of Truth (SSOT) for debugging analytics implementations! Are you a developer, analyst, or marketer committed to achieving top-tier web analytics and tracking results? Look no further! Our powerful debug tool is meticulously crafted to simplify your life. Analytics Debugger streamlines your daily debugging tasks, boasting user-friendliness for all while delivering in-depth insights to advanced users. v2.4.6 - Adds support for Chartbeat - Fixed Amplitude Regional Collection Endpoints 🛠️ Wide Compatibility: Our tool seamlessly supports a variety of analytics and tracking tools, including: - Google Tag Manager - Google Analytics - Tealium - Piwik Pro / Matomo - Adobe tools - and most commonly used Marketing Pixels. to mention some of them (Check the full list here) 🔒 Privacy Enhancement: Rest assured, our tool injects code only after DevTools has loaded, with no background monitoring. 🚀 Tools: Supercharge your tracking implementation with a rich toolkit including - GTM Preview Enhancer: USe this tool to bypass all the limitations from the original Preview Mode - Google Analytics Debug Libraries Loader - Block GA3/GA4 Hits: Prevent your - Export Features - Real-Time Data - Enhanced Ecommerce Reports - Data Filtering for Focused Insights - Clicks Blocker: Prevent being redirected to next page - and much more! Get started today and elevate your analytics debugging and optimization process effortlessly. Unlock the full potential of your analytics and tracking endeavors – streamline your workflow, enhance privacy, and gain profound insights seamlessly. Download now and experience the transformation! Changelog: You can check out our latest updates on our GitHub repository. https://github.com/analytics-debugger/analytics-debugger-browser-extension Support / Feedback: Offered via the Store or using the Github Repository Official Documentation: For detailed guidance, visit our official documentation at https://www.analytics-debugger.com/tools/browser-extension Don't miss out on this game-changing tool. Elevate your analytics game today!

Kameleoon Debug Assistant
Instantly see live experiments, feature flags, and personalization campaigns on your site and verify everything is firing correctly. Whether you’re a developer, QA engineer, or optimization specialist, the Kameleoon Chrome extension gives you the tools to troubleshoot issues, confirm behavior, and debug live Kameleoon activity without leaving your browser. What you can do: 🔍 Instantly view active experiments, feature flags, and personalization campaigns — and see which variation you’re bucketed into on any page. 📦 Check script size and understand the performance impact of each component. 🎯 Validate goals and custom data by previewing exactly what metrics are being tracked in real time. 🧠 Analyze tracking calls directly from your network tab to confirm data is firing as expected. 🚫 Block Kameleoon tracking calls when you need a clean, isolated test environment. 🧩 Customize what is contained in results tables and how they’re ordered. ✅ Verify which consent mode is applied live for full compliance visibility. Download the extension and click it to log in. Next, open Chrome DevTools, and click the Kameleoon tab. You’ll instantly see what’s live and how your setup is performing — right inside your browser. 💡 Note: This extension is for live-site diagnostics. To simulate campaigns before going live, use Kameleoon’s built-in simulation tool.

Tealium Tools
Evaluate website data, tags, and events with powerful tools for seamless Tealium iQ integration and server-side enrichments. Access quick links to documentation, training, and support, along with a catalog of custom tools built by the community. Improve your Tealium implementations with features like Web Companion for data layer validation, Server-side Trace for real-time action debugging, and Environment Switcher for seamless testing. Additional tools for troubleshooting, real-time interaction, and comprehensive testing ensure efficient, error-free setups. NEW FEATURES in V3: - New Side Panel Support - SSO Login - Click-and-Hold to Custom Sort - Built-in Feedback form 🔍 | Web Companion Easily inspect and validate your website's data layer, including cookies, JavaScript variables, and other critical elements. Fully integrated with Tealium iQ, Web Companion allows you to evaluate tags, extensions, and load rules directly on your web pages. 🎯 | Server-side Trace Monitor and debug your audience segmentation and real-time actions with Trace. Ensure the accuracy of visitor attributes, segment updates, and action firing to refine your digital marketing strategies. 🔄 | Environment Switcher Seamlessly switch between development, QA, and production environments within Tealium iQ to test and validate tags before deployment, ensuring error-free implementations across your digital properties. 🛠️ | uTag Debugger Diagnose and troubleshoot your Tealium iQ Tag Management setup with real-time logs that display tag execution and data layer interactions, ensuring accurate and efficient tag deployment. 💡 | Custom Tools Build complex and rich apps for the Tealium ecosystem. Custom tools allow you to run JavaScript on the current page, similar to an advanced bookmarklet, enabling you to gather data and create powerful, tailored tools for your specific needs. ➔ Real-Time Interaction: Make adjustments instantly with immediate feedback within your browser. ➔ User-friendly interface: Simplifies complex processes, making it accessible for both technical and non-technical users. ➔ Comprehensive Testing and Debugging: Provides tools for thorough testing and validation to ensure reliable performance and accurate data collection.

GreenIT-Analysis
The extension allows: - to measure the ecoIndex of a web site as defined by the ecoindex web site http://www.ecoindex.fr/quest-ce-que-ecoindex/ - to verify the application of web eco-design best practices defined by the "Collectif numérique responsable": https://collectif.greenit.fr/ecoconception-web/ The extension needs the following permissions: activeTab: permission used to access the current tab and allow the analysis of the web page content : permission used to access urls for analysis browsingData: permission used for the clean browser cache feature. tabs: permission used to display the analysis history in a specific tab