
aepejmjfaemcdkenmliibdpeooiogmpe


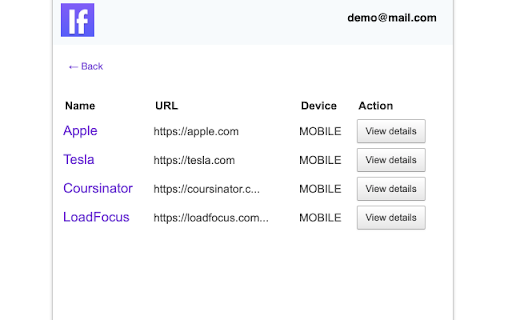
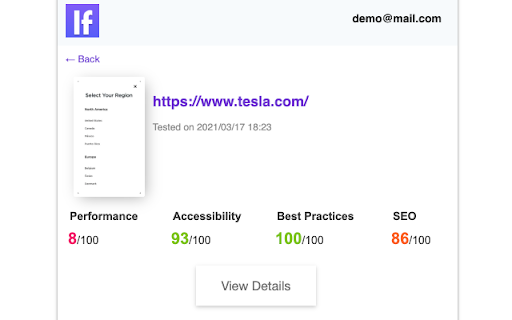
Website Speed Test and Page Speed Monitoring extension for web pages - LoadFocus. Monitor the speed of your web pages to deliver the best experiences to your customers. Get notifications and alerts for website performance issues. LoadFocus Website Performance Monitoring is powered by Lighthouse and focuses on modern user experience and performance metrics to help you deliver the best experience to your customers. Get insights with modern charts and user experience metrics. Test your website every hour & Compare with previous runs or competitors. Monitor Websites from multiple cloud regions on desktop and mobile devices. Receive page speed metrics and performance improvements instantly. We keep all your results history to better compare between different runs and understand your speed performance. Run tests from multiple locations around the world for a better and more realistic results. Page Speed insights on metrics that actually matter, like: First Contentful Paint, Speed Index, Largest Contentful Paint, Total Blocking Time, Cumulative Layout Shift, Time to Interactive Visual Complete with Easy-to-use data reports. Create a free account with LoadFocus and use the extension to monitor the speed and performance of your website and web pages from the cloud with no coding skills needed.

Pagespeed Test - cmlabs SEO Tools
Pagespeed Test is a tool to helps you monitor the webpage performance on desktop and mobile devices based on several metrics. Introducing PageSpeed Test, a cutting-edge and free tool designed to revolutionize your website's performance monitoring. This tool empowers you to examine your website's speed metrics, ensuring optimal user experience across desktop and mobile platforms. PageSpeed Test leverages the power of Lighthouse integration to offer a comprehensive assessment of various performance indicators; performance, accessibility, best practices, SEO, and PWA (Progressive Web App). Download and try now! This tool is available for free. With this tool, you can assess website performance based on several metrics: 1. Performance Ensure that your web pages are optimized for users so that they can see and interact with your website. Several metrics affect web page performance ratings, including: Core Web Vitals, in the performance assessment, you'll see some metrics such as: (a) First Contentful Paint or FCP: the time it takes for the first text or image to appear on a website. (b) Largest Contentful Pain or LCP: how long it takes the website to load the largest elements on the page such as images or long text. (c) Cumulative Layout Shift or CLS: measures the stability of the content on the website. (d) Time to Interactive or TTI: The time it takes the website to load most of the content until the website can respond to user input quickly (ideally less than 50ms). (e) Speed Index: The time that shows how fast the loading process is until all pages can be displayed clearly in the viewport. (f) Total Blocking Time or TBT: The total time the page was unable to respond to user input. 2. Accessibility To assess how easily users can access your page, especially for users with physical or cognitive disabilities. This tool will check your HTML tags, alt tags, ARIA landmarks, and others. 3. Best Practice To examine some areas for improvement of your overall website and keep your website secure, create a good user experience, avoid using outdated technology, and more. 4. SEO This tool also allows you to see if your web pages have been optimized to rank better in organic search. 5. PWA This tool also provides validation results for the Progressive Web App (PWA) aspects to ensure the website can be accessed quickly from various locations and types of devices. 1. Go to PageSpeed Test Page Starting from adding the URL to be checked for page speed, displaying the results of the page speed check, to the page speed checking history that you have done before. 2. Enter Website URL Make sure you have entered the URL in the correct format (e.g. https://example.com). Next, click the "Generate" button to give the command to this tool to start checking page speed on the website. 3. PageSpeed Check Result Analysis You need to wait a while until the PageSpeed Test assessment process is complete. Some of the metrics you can find in your results are: (a) Performance: Showing the test results of core web vitals metrics, time to interact, total blocking time, to speed index. (b) Accessibility: It is assessed based on how easily the website can be accessed by users. (c) Best Practice: Contain information on whether your website has implemented best practices in website creation. (d) SEO: The following report will contain information on whether your website has been optimized on search engines or not. (e) PWA: You will see whether your website has met the Progressive Web App (PWA) criteria. If the website has not implemented PWA optimally, this can be a sign that you have found a space that needs to be improved on your website. 4. View PageSpeed Test Usage History The last thing you can do using PageSpeed Test is look at your history of using the tool. In the list, you will see a list of website URLs that you have checked using the PageSpeed Test tool from cmlabs. 5. Login After 5 Times of Use If you have used it 5 times, our system will automatically display a message stating that you have reached the usage limit. You can log in by clicking the login button on the warning message that appears. We value your feedback! If you have any suggestions for improving Pagespeed Test or encounter any issues while using the tool, please don't hesitate to let us know. Our support team is here to help. Reach us by email at:

SiteSpeed Checker
Displays page load speed using Google PageSpeed Insights API Site Speed Checker is a powerful SEO Chrome extension that helps you measure the loading speed of any website. With Site Speed Checker, you can quickly determine how fast a website loads, and identify any issues that may be slowing it down. 1. Measure the loading speed of any website with just one click 2. See detailed information about the website's loading time, including the time to first byte, total load time, and more 3. Identify any issues that may be slowing down the website, such as large images or slow server response times 4. Compare the loading speed of different websites to see how they stack up against each other 5. Use the extension to optimize your own website's loading speed and improve user experience Whether you're a website owner, marketer, or developer, Site Speed Checker is an essential tool for optimizing website loading times and providing a better experience for your users. Try it today and see how it can improve your website's performance!

PageSpeed Insights
Page Load Speed Insights Chrome extension Enhance your browsing experience and gain invaluable insights into website performance with the PageSpeed Insights Chrome Extension! This tool empowers you to effortlessly analyze the speed and optimization of any website, helping you understand its performance metrics with the click of a button. Instant Analysis: Quickly assess the loading speed and performance of any webpage directly from your Chrome browser. Detailed Metrics: View detailed insights on critical performance indicators like First Contentful Paint (FCP), Time to Interactive (TTI), and more. Mobile & Desktop Testing: Evaluate the performance for both mobile and desktop versions of websites, giving you a holistic view. Optimization Insights: Receive actionable recommendations on how to enhance website speed and user experience. Third-Party Diagnostics: Identify and analyze the impact of third-party scripts and resources on loading times. User-Friendly Interface: Enjoy a clean, intuitive interface that displays key metrics and insights in an easy-to-understand format. Install the Extension: Click "Add to Chrome" to install the extension. Open the Sidebar: Click the PageSpeed Insights icon in the browser toolbar to open the analysis sidebar. Analyze: Automatically analyze the current webpage with only the click of the icon. Review Results: Instantly view key performance metrics and suggestions for improvement. Why Use PageSpeed Insights Improve User Experience: Understand and enhance the speed and usability of your websites, creating a better experience for visitors. Boost SEO: Optimize your site’s performance, aligning with search engine guidelines and improving SEO rankings. Analyze Competitors: Gain insights into competitor websites, understanding their performance strengths and weaknesses. Continuous Improvement: Regularly monitor and optimize websites for ongoing improvements. Install the PageSpeed Insights Chrome Extension now and take control of website performance and user experience with ease!

SpeedVitals
SpeedVitals Extension helps you perform the Web Vitals Speed Test and TTFB Test on any website directly from your browser. SpeedVitals is a free Web Performance measurement tool that uses Lighthouse to measure Lab Data and Chrome's User Experience API (CrUX) to measure field data. 1) Web Vitals: Measure all the Web Vitals such as First Contentful Paint (FCP), Largest Contentful Paint (LCP), Cumulative Layout Shift (CLS), First Contentful Paint (FCP), Time to Interactive (TTI), and Speed Index (SI). We also measure some other metrics like Server Response Time (TTFB) and Web Page Size. 2) TTFB Testing: Measure TTFB (Time to First Byte) from 40 locations across the globe 3) Multi-Device Testing: Measure your Website's Performance across more than 30 devices having different Form Factors 4) Multi-Location Testing: Run Core Web Vitals test on more than 35 locations across the globe including United States, United Kingdom, India, Japan, Australia, Germany, Brazil, South Korea, and more. 5) Field Data: View the real-world Core Web Vitals data of any Web Page using Chrome's User Experience API. 6) Resource Graphs: Resource Graphs give a visual representation of Web Page resource distribution. 7) Waterfall Chart: Waterfall Chart provides a visualization of the load timings with metrics like Blocking Time, DNS Lookup Time, TCP Connect Time as well as HTTP Request/Response Header information. 8) Layout Shift Visualizer: Layout Shift Visualizer presents a GIF of Cumulative Layout Shift (CLS) and helps diagnose the cause behind the shift 9) Code Coverage: Code Coverage helps identify the resources (CSS/JavaScript) with unused code segments 10) SpeedVitals Pro Tips: SpeedVitals Pro Tips is an advanced curated list of factors that can dramatically speed up a Web Page. It also includes advanced platform-specific tips for CMSs like WordPress