
mccagcbgocbjhgbmjkpndpeolhcnaene


SpeedVitals Extension helps you perform the Web Vitals Speed Test and TTFB Test on any website directly from your browser. SpeedVitals is a free Web Performance measurement tool that uses Lighthouse to measure Lab Data and Chrome's User Experience API (CrUX) to measure field data. 1) Web Vitals: Measure all the Web Vitals such as First Contentful Paint (FCP), Largest Contentful Paint (LCP), Cumulative Layout Shift (CLS), First Contentful Paint (FCP), Time to Interactive (TTI), and Speed Index (SI). We also measure some other metrics like Server Response Time (TTFB) and Web Page Size. 2) TTFB Testing: Measure TTFB (Time to First Byte) from 40 locations across the globe 3) Multi-Device Testing: Measure your Website's Performance across more than 30 devices having different Form Factors 4) Multi-Location Testing: Run Core Web Vitals test on more than 35 locations across the globe including United States, United Kingdom, India, Japan, Australia, Germany, Brazil, South Korea, and more. 5) Field Data: View the real-world Core Web Vitals data of any Web Page using Chrome's User Experience API. 6) Resource Graphs: Resource Graphs give a visual representation of Web Page resource distribution. 7) Waterfall Chart: Waterfall Chart provides a visualization of the load timings with metrics like Blocking Time, DNS Lookup Time, TCP Connect Time as well as HTTP Request/Response Header information. 8) Layout Shift Visualizer: Layout Shift Visualizer presents a GIF of Cumulative Layout Shift (CLS) and helps diagnose the cause behind the shift 9) Code Coverage: Code Coverage helps identify the resources (CSS/JavaScript) with unused code segments 10) SpeedVitals Pro Tips: SpeedVitals Pro Tips is an advanced curated list of factors that can dramatically speed up a Web Page. It also includes advanced platform-specific tips for CMSs like WordPress

Core Web Vitals Visualizer
Measure, visualize, and debug Core Web Vitals in real time. CrUX history, LCP/CLS/INP breakdowns and performance experiments Core Web Vitals Visualizer Open the popup on any page. See your LCP, CLS, INP, FCP, and TTFB scores instantly, color-coded, live. No separate tool. No copy-pasting URLs into PageSpeed Insights. What it shows Real-time scores powered by the web-vitals library, the same library Chrome uses internally. Green means good. Orange means work to do. Red means it's hurting you. LCP - Green overlay marks the LCP element on the page. Full timing breakdown: TTFB, Resource Load Delay, Resource Load Duration, Element Render Delay. For images: preload status, fetchpriority, 1st vs 3rd party origin, natural vs rendered dimensions, estimated preload savings. CLS - Pink overlays mark every layout shift source. Click any shift to see an animated before/after replay. Attribution shows the largest shift target and score. INP - Broken down into Input Delay, Processing Duration, and Presentation Delay. Shows interaction type, target element, and page load state at time of interaction. FCP and TTFB - -FCP splits into Time to First Byte vs First Byte to FCP. TTFB splits into Cache, DNS, Connection, Request, and Waiting. CrUX history 25 weeks of Chrome User Experience Report data for any site or URL. Toggle between P75 scores and good/needs-improvement/poor distributions. Switch between mobile and desktop. Trend lines show whether each metric is moving in the right direction. Render-blocking resources Every render-blocking stylesheet and script listed with individual file timings and total blocking duration. Performance experiments Test fixes without touching your code. Disable JS, defer all JS, or block third-party JS. Lazy load images, de-prioritize background images, disable web fonts or third-party CSS. Run any experiment with cache cleared to measure real cold-load impact. Network throttling Simulate slow 3G with CPU throttling. Clear cache and reload to measure cold performance. Built for developers Minimal permissions. No data collection. Everything runs locally. All vitals logged to the console for debugging. One-click links to CrUX Dashboard, PageSpeed Insights, and the W3C HTML Validator for the current page. changes: 1.19 New Signal scan and minor fixes 1.18 Fixed INP attribution logic 1.17 Redesign of Experiments and new Audit tab, Minor logic an UI fixes 1.16 Added content audit, refactored experiments and minor layout improvements 1.15 Minor fixes 1.14 Added Treo.sh link, removed depricated looker studio report, added crux lcp subparts, rtt. navigation types and lcp types 1.13 Added CrUX Vis link, better fallback for missing CrUX data and small bigfixes. 1.12 Better messaging + improved elementtiming, better logging to console 1.11 Removed the FID, the Web Vitals are now based upon the upcoming v4 of the web vitals library, new breakdown details, improved CSS visualization, small bugfixes, code cleanup. 1.10 Promote INP to a Core Web Vitals and demote FID to a metric of interest! 1.9 CrUX history API, small fixes, more CLS info 1.8 Better metric updates, better logging, minor improvements 1.7 Log Events, Long Tasks and Long Animation Frames to the console that happen during and might interfere with the INP. 1.6 Better INP Breakdown, minor code improvements. 1.5 code improvements, layout improvements, added page experiments (defer javascript, disable javascript, disable third party scripts, lazy load images, defer background images & disable webfonts). 1.4 left side menu, more information about render blocking resources and direct links to PSI, CrUX dashboard and W3C. 1.2 added lots of LCP information like preloading, fetchpriority, rendering breakdown, first or third party etc.

CLS Visualizer
Visualizer the CLS of any webpage This plugin will highlight and visualize the Cumulative Layout Shift. Cumulative Layout Shift (CLS) is an important, user-centric metric for measuring visual stability because it helps quantify how often users experience unexpected layout shifts—a low CLS helps ensure that the page is delightful. Unfortunately the CLS is a pain to debug without visualisation

Core SERP Vitals
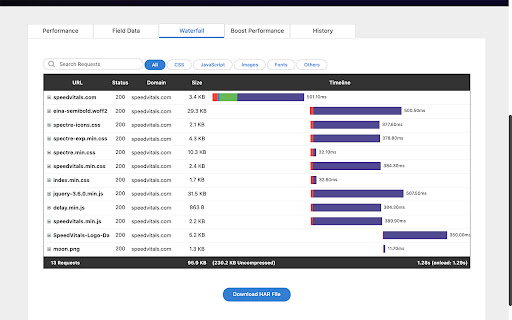
Show the Core Web Vitals data from the Chrome User Experience Report in the Google Search Results. Show real world Core Web Vital data from the Chrome User Experience Report in the Google Search Results. Displays LCP, FID, CLS (and the experimental INP and TTFB) metrics underneath the page links in the Google SERP where data is available in the CrUX report. * Note: Requires a free API key for the Chrome UX Report API. * https://developers.google.com/web/tools/chrome-user-experience-report/api/guides/getting-started Updates: Version 1.3.0 - Now displays the experimental INP and TTFB metrics.

WP Hive | A Better WordPress Plugin Repo
The WP Hive Chrome Extension is another revolutionary step for WordPress users, right from Chrome itself. Have you ever wondered how much impact a plugin has on your WordPress website? WP Hive’s Plugin testing tool automatically tests a plugin and gives you better insights. Easily discover new plugins or the popular ones with relevant filters. Even compare plugins like you do for phones. Get useful metrics such as impact on memory usage & pagespeed, PHP errors, warning or notices, Javascript issues, PHP 7.4 compatibility, latest WordPress 5.5 version compatibility, database footprint, activation error, resource errors - right from your WordPress.org page. WP Hive automatically tests all WordPress plugins to get useful metrics and shows them inside the WordPress.org plugin pages. You can also compare a plugin with another plugin from WP Hive and get a detailed insight of the plugin. The extension also offers an option to redirect to WP Hive plugin page for a particular plugin. Sure, WordPress repository is great, but WP Hive makes it even better with better insights & adding more value to users. The privacy policy can be found here: wphive.com/privacy-policy/