
opaggfgfigelejhglpjdonaofkbgenoc


- New filtering option: Flow debug lines - General bugs fixes and improvements

Salesforce Show Api Name
Salesforce Show API Name The easiest way to view and copy API names in Salesforce 1. Shows API names for all fields and objects 2. Works in both Classic and Lightning 3. Copy single or multiple fields with one click On any Salesforce record page: 1. Click the extension icon to show/hide API names INSTALLATION Get it from the Chrome Web Store or install manually from: https://github.com/ChenZaichuang/salesforce_show_api_name

Salesforce Colored Favicons
Updates the standard favicon on Salesforce tabs with colored versions to help differentiate between different organizations. Supports both Classic and Lightning Experiences and includes separate icons for production, sandbox, and develop/scratch orgs. To use the extension, simply navigate to a Salesforce org and the extension will automatically select a random color for it then update the favicon with that color. Now every time you visit that org, the colored favicon will be displayed instead of the default Salesforce favicon. At this point you can also visit the options page to change the color for any org you've visited.

Salesforce advanced Code searcher
By using the advanced quick find you can get your code few clicks shorter. Also, you can search any string your code Using this extension you can search your code components your salesforce instance: 1) apex Classes 2) Apex Triggers 3) visualforce Pages 4) Visualforce Components 5) Lighting Component In addition to the above you can use this extension to jump to classes / pages / triggers from the advanced quick find section on the left hand side. How to make it work in Lightning: 1) We embed the extension in the setup page. Please navigate to the setup home page where you can find the extension injected in the right. 2) You need to authorize (this is a one time activity) for the application to make the API calls. 3) On clicking the button, you will be navigated to the Salesforce to authorize. Once you have successfully completed the authorization, you will be redirected back to the home page. 4) Once this is done, all the functionalities will be enabled. Both the below section get added in the set-up pages, so this is only useful for developers and Admins, this tool will not make any sense for salesforce users. 1) Advanced Quick Find section:This part gets added in side navigation bar on all set-up pages. Select the code component that you want to go to, then start typing the name of the code,an autocomplete suggestion pops up, select the one that you want to go to. 2) Developer Utilities: 2.1) This component get added in force.com home page only. Let's say you want to know where you have hard-coded a profile name in your code, like if(profile.name =='sys Admin'){//you're doing something}. Right now to find this out you have to either go thru all the code individually or create a force.com project in eclipse and then search there. There's no way we can do this directly in salesforce. This string search will help you do that. You have to check the code components in which you want to search the code, enter a string in the input text field and hit enter. You will be presented with a list of code components where the string is used. 2.2 ) Code Coverage Extract: You can View and download the code coverage in your org. 2.3 ) This extension now allows you to lint the lightning code via the Lightning Linter tab. 2.4 ) You can now run PMD against your code 2.5 ) Added a new tab which will allow the users to view the record and its child information . update 1.22 Improved the static code analysis functionality update 1.15 Added the LWC Editor with Autocompleting for html & xml files. update 1.10 Added the ability to get the record Information by just giving the record Id. update 1.8, 1.9 Added support for the application to work on lightning update 1.4.2 Added support for Custom label Addes support for Apex PMD Update 1.1.1 Expanded the quick search scope to Email Templates, Validation Rule, Workflow Rule, Custom Object Added edition checks. Update 1.2 Update the UI to be more in sync with Lightning Update 1.3 Added Code coverage Extract section allowing user to view and download the code coverage. Update 1.3.3: UPdated the cookie issue. NOTE: 1) Salesforce's REST API is used to accomplish the above functionalities Update 1.3.5 1) Added support to delete all the Debug logs 2) Added a button on traceflag to renew the startDate / expiration date.

Salesforce Speedy Debugger
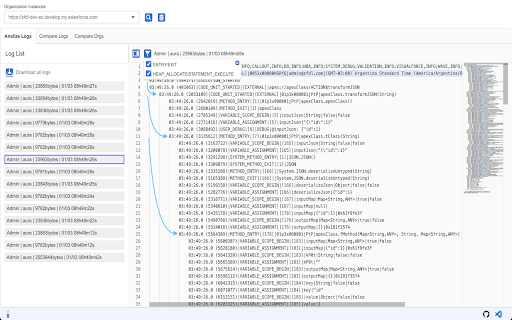
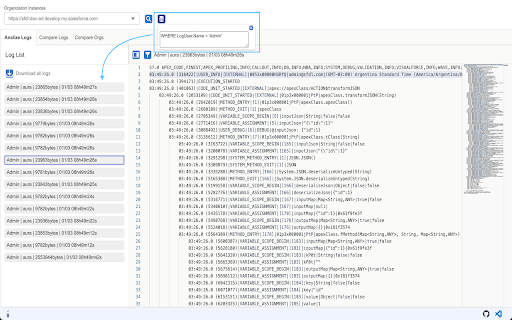
Easy way to check the Debug logs Salesforce Debugger Chrome Extension Salesforce Debugger Chrome Extension is designed to streamline the debugging process for salesforce developers.This extension offers a comprehensive suite of features aimed at simplifying the management of Trace Flags and Debug Logs within the Salesforce environment. Whether you're troubleshooting code errors, monitoring system behavior, or optimizing performance, this tool provides efficient solutions tailored to your debugging needs. With intuitive functionalities and seamless integration into your Salesforce workflow, this extension empowers developers to efficiently trace, analyze, and resolve issues, ultimately enhancing productivity and accelerating development cycles. From managing Trace Flags to searching and filtering Debug Logs, this extension equips developers with the tools needed to effectively debug and optimize their Salesforce applications. In this document, we'll provide a concise overview of the extension's key features, outlining how each functionality enhances the debugging process for Salesforce developers. Whether you're new to debugging in Salesforce or seeking to streamline your current workflow, this extension offers a user-friendly interface and robust capabilities to support your debugging endeavors. 1. Add Current User (Button): ● If the trace flag for the current user (logged-in user) is not active, prompts to create a new trace flag. ● If the trace flag for the current user is active, displays active records and allows creating a new trace flag by selecting debug level. It replaces the existing trace flag upon saving. 2. New (Button): ● Creates a trace flag for a user based on TraceEntityName, StartDate, Expiration Hours, and DebugLevel. ● Handles creation for active users, prompts for error on past date selection, and disables save button until debug log is selected. ● Toast notification on successful creation. 4. Delete (Button): ● Deletes the selected record and notifies the user on the scrolled page. ● Shows error toast if the record is deleted from the org while editing, deleting, or renewing on the extension side. 5. Renew (Button): ● Renews trace flags for the next 24 hours. ● Shows error if the trace flag exists for the same traced entity, prompting the user to replace it upon saving. 1. User Search Functionality: ● Enables users to search debug logs of active trace flag users. ● Filters debug logs using various options, allowing addition and removal of user names. 2. Search String Functionality: ● Facilitates searching strings within the debug log body. ● Highlights rows containing the searched string, with automatic de-highlighting upon change. ● Highlights only the first page of pagination on search. 3. Action Tabs: ● Provides options to get all logs of the logged-in user, refresh all logs, and delete all logs. 4. View (Button): ● The "View" button offers a comprehensive insight into various aspects of the debugging process, presenting a series of sub-tabs each with distinct functionalities. Within these tabs: ➢ Log Details: Users can access creation dates, log lengths, and associated user information. ➢ Debug Log: This tab displays the debug log body, color-coded to represent different labels for enhanced readability. ➢ Queries: Developers can review all SOQL queries present in the debug log, including details such as the line number in the Apex class or trigger where the query is written, the number of records retrieved, and the option to navigate directly to the query line within the debug log. ➢ User Debug: Custom debug data, such as that generated by system.debug statements, is consolidated in this tab. Users can identify the line number where the debug statement is written, view the printed data, and navigate to the specific debug line within the debug log. ➢ Order of Execution: This tab provides insights into debug log limits usage, detailing various limitations such as API call usage or heap size. Users can monitor their usage compared to set limits, with color-coded alerts indicating when usage exceeds 80% (yellow) or reaches 100% (red). ➢ Org Limits: Users can access organization-wide limits across different categories presented in a tabular format, facilitating a comprehensive overview of the current usage and thresholds within the Salesforce environment. ➢ Download: Users can download debug logs in Excel format with subtabs available on the page. 6. Delete (Button): ● Deletes the selected record and notifies the user on the scrolled page. Note: To perform all the activity mentioned above, tool will be used to access the active session id from browser for respective salesforce org.