
oghoceohpfhokhcoomihkobmpbcljall
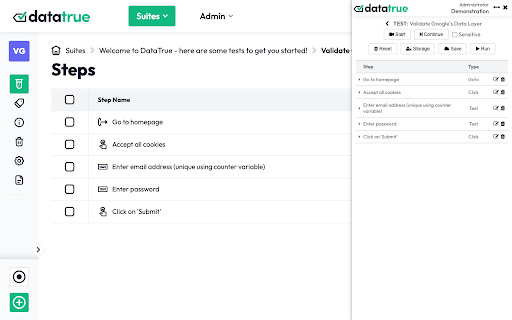

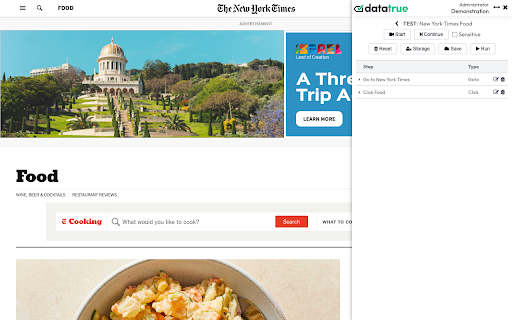
Make testing and monitoring of tags simple with DataTrue. Use the DataTrue Test Builder tool to easily create tests in DataTrue. DataTrue is a data assurance and tag testing tool that enables: Monitoring of complex workflow interactions Create tests that validate your tags across complex ajax interactions, iframed content and across top level domains. Easy test creation Create workflow tests easily by interacting with your site using our Test Builder. Discover tags onsite with the Tag Discovery tool. Quickly configure tests using our template library of tags. Comprehensive reporting Receive detailed reports including page load timing and tag validation. Drill down to detailed information about test results to resolve errors, including viewing tag data payloads and errors written to the test browser console. Tag Regression Testing Undertake regression testing of tag modifications to protect your tag updates from errors. Custom tag support Allows for testing of custom tags such as in-house developed tags.

Debugger for Adobe Analytics
Adobe Analytics Debugger for POST and GET requests. Prints following info: - displays all page load data, link events, file downloads - shows information about data collection servers and informs if it is an RDC server or not - provides recommendations on how to improve the implementation - displays Adobe Marketing Cloud visitor ID and Adobe Marketing Cloud organisation ID

ObservePoint Debugger
Troubleshoot analytics tags, variables, events, cookies, and more. Supports Adobe Analytics, Google Analytics, and thousands more. Now with GPC, Accessibility Scanning, and a dedicated Cookies tab! Easily audit page accessibility, and view, search, and manage all browser cookies—the perfect all-in-one replacement for niche debugging tools. Overview ObservePoint’s Debugger is a free Chrome Extension for troubleshooting analytics, marketing tags, cookies, and web accessibility directly in Chrome DevTools. It captures page-load and event-triggered requests, parsing them into a clean, human-readable format for easy debugging and compliance checks. Key Features 🔹Simulate GPC Signals Instantly: Validate and compare tag and cookie compliance with Global Privacy Control (GPC) enabled directly inside the extension, eliminating the need for separate browser plugins or manual header workarounds. 🔹Accessibility Testing: Instantly scan any page for WCAG compliance issues. Identify errors in color contrast, ARIA labels, heading structures, and more to ensure an inclusive user experience. 🔹Cookies Tab: Quickly inspect all browser cookies in one place—including those set by tags and scripts. Filter and sort by name, value, domain, path, and expiration to understand privacy implications. 🔹Tag Inspection: See exactly what data is being sent to your analytics and marketing platforms in real-time. Why Use ObservePoint The Debugger is the first step toward comprehensive governance of your digital properties. The full ObservePoint platform helps you: 🔹 Audit Accessibility: Scan entire domains for WCAG 2.1/2.2 compliance. 🔹 Monitor Data Accuracy: Scan pages or user flows to ensure tags fire correctly. 🔹 Protect Privacy: Identify and categorize cookies set by third-party scripts. 🔹 Test Pre-Release: Validate implementations in dev and staging environments. 🔹 Automate Quality: Get alerts when tracking, compliance, or critical paths fail. How It Works After installation, open Chrome DevTools → ObservePoint tab → Refresh the page. See which tags, cookies, and accessibility violations appear, including: 🔅 Accessibility Health: Details of WCAG errors and warnings. 🔅 Tag Details: Name (GA4, Adobe, OneTrust), Account ID, and Category. 🔅 Tag Performance Metrics: Status, Request Size, and Latency. 🔅 Cookie Intelligence: Expiration dates and source attribution. Click any item to view variables, decoded request data, or specific remediation guidance for accessibility errors. Export your findings as an Excel file for easy sharing. Get Started The ObservePoint Debugger is a powerful alternative to WASP, OmniBug, Accessibility Insights, or Tag Inspector. 1. Enable the extension under Chrome → More Tools → Extensions. 2. Open DevTools (Ctrl+Shift+I / Cmd+Opt+I). 3. Select the ObservePoint tab. 4. Refresh your page. For cookies and accessibility, no refresh is required. 5. Start debugging! By installing, you agree to the ObservePoint Terms of Service: https://www.observepoint.com/service-agreement/ Learn more: https://help.observepoint.com/en/articles/9113174-observepoint-debugger-chrome-extension

Universal Adobe Debugger
Universal Adobe Debugger is a powerful Chrome extension for debugging Adobe Analytics, Adobe Experience Platform (AEP), Adobe Web SDK, and Adobe Launch (Tags) implementations. Built by analysts for analysts, this tool helps you validate tracking, inspect payloads, and troubleshoot Adobe Experience Cloud integrations directly from the browser console. Simply open DevTools and trigger Adobe Analytics or Web SDK calls to instantly view structured, readable debugging output. Log and inspect Adobe Analytics server calls (AppMeasurement, s.t, s.tl) directly in the console for faster troubleshooting and QA validation. Access rule execution details and implementation diagnostics to verify Launch configurations with ease. Monitor Adobe Experience Platform Web SDK requests and XDM payloads with clean, formatted console output — no more digging through nested objects. Replace Adobe Launch libraries seamlessly to test and validate implementations in real time. Access a curated collection of debugging snippets for analytics validation and consent troubleshooting. Verify Adobe Launch rules and data layer mappings Improve tracking accuracy and data quality Streamline QA workflows for analysts and developers Whether you're an Adobe Analytics specialist, AEP implementer, Launch developer, or digital analyst, Universal Adobe Debugger helps you debug smarter and ship cleaner data. Found a bug or have a feature request? Contributions and feedback are welcome. Visit our GitHub repository at https://github.com/cthae/Adobe-Launch-Debugger to report issues or suggest improvements. Changelog: 2025-04-06 -> 1.25 * [x] Add an option to disable displaying of the Target "decisioning" web sdk requests. To reduce clutter. * [x] Identify "decisioning" web sdk requests as Target rather than PV. Correct the call name. 2025-03-30 -> 1.24 * [x] Add a color picker set of settings that would allow users configure the colors of console printouts. * [x] Make a snippet shortcut to delete all cookies and local storage present on the active tab. * [x] Make OT printouts not fuzzy again. 2025-03-09 -> 1.23 * [x] CSS refactory * [x] Better bookmarks design * [x] Add an option for the light mode for the extension's UI. * [x] _satellite decided to become touchy about setDebug() using a truthy arg. Replace 1 with true. 2024-12-10 -> 1.22 * [x] Reimplementation of Adobe Experience Cloud Bookmarks * [x] Rename tabs to icons * [x] Move the redirects tab to somewhere else. To Settings and Home probably * [x] Make a New Tab for bookmarks * [x] Add a setting to choose the tab that would be opened by default when the popup renders (Home/Settings/Bookmarks) * [x] Clean up redirections. Add a message for when there's no redirections yet. 2024-11-08 -> 1.21 * [x] Change the extension icon depending on the env: * grey for when the extension hasn't yet executed all code or doesn't have the permission to do so; * green indicates that the Launch env is production; * yellow indicates that the Launch env is dev or staging; * red indicates that the Launch library is not loaded or loaded incompletely. Basically, _satellite?.environment?.stage is falsy. The rest of the functionality won't be stopped by this, however. * [x] Update the extension icon. * [x] Disable Launch UI improvements on by default. * [x] Multiple small bugfixes and refactories. 2024-10-04 -> 1.20 * [x] Add onInstalled/onStartup callbacks to set the default set of settings specifically for those who don't open the popup after installation. * [x] Support for Mozilla FF. Same extension. Cross-browsers. Seems like mostly only background will have to be reimplemented, but many APIs may be off. We'll see. 2024-10-01 -> 1.10 * [x] Appmeasurement: Prettify the product string printing. * [x] Appmeasurement: Add transaction id in the product string prettifier. * [x] Implement Launch UI improvements POC: * [x] Launch UI: Add the red indicator whenever a lib is not selected. * [x] Launch UI: Add a hint about how to change the Launch UI via Chrome flags. * [x] Add an option to print general alloy config in the snippets tab. Make sure it does so for all Alloy instances. 2024-09-02 -> 1.09.1 * [x] Rename the content-script.js to something more interesting. It's visible in the console and can be filtered by. * [x] Web SDK: Further improve the custom logging, allowing shorthands: p12/c12/v12/e12/l2. * [x] Apply all the shorthanded custom logging to Appmeasurement logging too. 2024-08-26 -> 1.09.1 * [x] Fix a bug in custom logging, in event shortcuts for the data.__adobe.analytics usecases. * [x] Fix a bug in custom logging, in prop shortcuts for the data.__adobe.analytics usecases. 2024-08-25 -> 1.09: * [x] Web SDK: Expose the event type in the logging header. * [x] Web SDK: Improve the custom logger to also check the data.__adobe.analytics object when using shortcuts. * [x] Web SDK: Make it easier for non-technical people to use the custom logging: don't require them to specify the full path to evars, props or events for xdm payloads. If users ask for evars and it's an xdm event, just add the correct path to it. * [x] Reimplement page load time to something like performance.getEntriesByType("navigation")[0]?.duration 2024-08-20 -> 1.08.1: * [x] Increased the delay at which the response is no longer expected to six seconds. Because AA can be very slow to respond. 2024-08-18 -> 1.08: * [x] Web SDK: On errors, in custom logs, add an indication that the request resulted in an error. This is for people who use filters in the console like pros. Thanks Arun for noticing. * [x] Web SDK: MVP tracking the navigator.sendBeacon() ping network requests. No access to their payloads, however, because the Chrome devteam neglects fixing related bugs. * [x] Delete requests from the map on other callbacks too to avoid misreporting calls as such that didn't receive the server response. 2024-08-14 -> 1.07.01: * [x] Increased the delay at which the response is no longer expected to two seconds. * [x] Cleanup. 2024-08-13 -> 1.07: * [x] Print the extension version, getting it from the manifest. * [x] UX improvements, CSS fixes. * [x] Add a bug submission button in info. * [x] Web SDK: Add an option to log all fields there are, giving the user the raw object. * [x] Add a callback and error logging for "cancelled" requests. That's when the browser cancels the request. And a few other types of requests. Thanks to Arun for the suggestion. * [x] Web SDK: Apply the error logging logic to Web SDK tracking too * [x] Small popup UI improvements. 2024-06-02 -> 1.06 - Byanka: * [x] Replace the counter of PVs and links with AA calls and WebSDK calls * [x] Web SDK: Improve autodebugging: indicate when linkClicks will be treated as pageviews in AA due to the web fields set. * [x] Web SDK: Surface the Edge config ids for every request, make them visible just like AA Report Suites. To ease the debugging of multi-destinational tracking. First 5 characters should suffice. * [x] Web SDK: Improve the tracking of network errors when edge network requests fail. * [x] Web SDK: Refactor logging. Make it less confusing. No more nested groups. * [x] Web SDK: Change the default logging a bit to maybe try and expand the analytics object automatically. * [x] Web SDK: Add a setting to remove the essentially useless xdm fields that are rarely useful to look at. On by default. * [x] Web SDK: Improve the logging for non-object fields. * [x] Web SDK: Add logging for the data.__adobe object. Off by default in settings. * [x] Web SDK: Reinforce the custom logging field, allow people to use the xdm. reference in the list of params. For older versions, please refer to github releases here: https://github.com/cthae/Adobe-Launch-Debugger/releases

GTM Copy Paste
Copy your Tags, Triggers and Variables and Paste them into any other account Easily Copy and Paste your Tags, Triggers, and Variables from one Google Tag Manager account to the next. Simply add them to the extension and then paste them into your intended account. Your items will be uploaded through the GTM API. You can put together your own menu of Tags, Triggers and Variables that you want to copy to another account. No more Container exports and reimports through the GTM Admin interface. Notes: - The relationship between Tags and Triggers will remain intact as long as they are part of the same "paste". - If an asset (Tag, Trigger or Variables) under the same name already exists, the extension will upload the asset with "(#)" attached to the end of the name. - Completely re-written the extension (March 2025): - newly improved "copy" experience - new UI for the clipboard - dependency check feature to add all dependancy to the clipboard - the oauth scope now ask for less permissions - now supports templates, tag sequencing, built-in variables and dependency rewrites Known issues: - If you edit an item right before you copy it to the clipboard, it might not have the changes in the paste. That’s because the extension is working with a cached version of the container. - If you copy a tag connected to a template, the upload might fail because it can’t find the reference - If you delete a dependant item from the clipboard, the upload might fail as it doesn’t have the right items to connect back while pasting