
nelkodgfpddgpdbcjinaaalphkfffbem
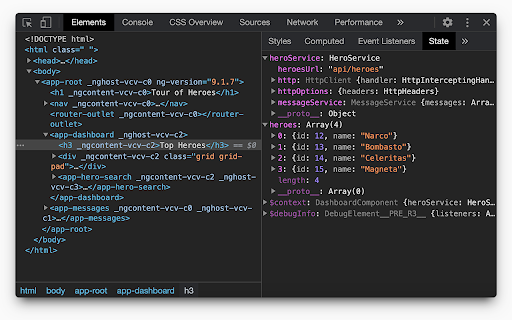
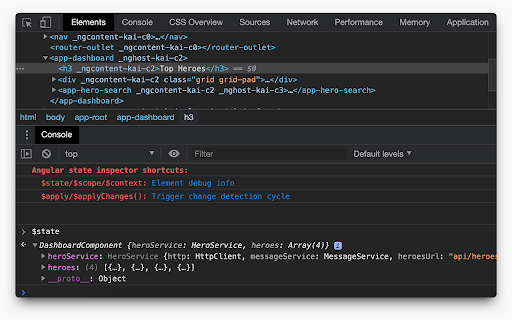
Helps you debug Angular component state. Supports Angular 1/2+/Ivy! Angular State Inspector for Angular Extends the Chrome Developer Tools for Angular web apps. Adds new panel "State" to Elements tab, that displays the state of selected element. Prints state of selected element in console by calling "$state" variable. Depending on angular version it can show: - Component state - Directives - Context, like ngForOf or ngIf values - Event listeners If they are applicable to the current element. Angular State Inspector also allows you to modify the values in the "State" panel (double click on value) and from console(e.g. $state.title = 'new value'). To apply changes just call $apply() in console. See all supported commands in chrome console. Version 1.4.6: - Show info message if $ctrl is not available in selected scope. - Update $state object even if it's not available. Version 1.4.5: - [ivy] Show info from ng.getComponent(). If it's null then show OwningComponent state. Version 1.4.4: - update extension logo Version 1.4.3: - Return result emoji on `$apply()` call Version 1.4.2: - Fixed props editing and change detection Version 1.4.1: - Print always up to date state in console Version 1.4: - Full support angular 9 Ivy api Version 1.3: - Added experimental support of Ivy - Added shortcuts that you can use in console

AngularJS Graph
This adds new browser inspector tab, "AngularJS Graph" to browse your AngularJS graph. http://angularjs-graph.org/ Features: - components and modules view - update graph on reload - ignore and filter modules - sticky nodes - zooming and panning - filtering by component type

Allow CORS: Access-Control-Allow-Origin
Easily add (Access-Control-Allow-Origin: *) rule to the response header. Allow CORS: Access-Control-Allow-Origin lets you easily perform cross-domain Ajax requests in web applications. Simply activate the add-on and perform the request. CORS or Cross-Origin Resource Sharing is blocked in modern browsers by default (in JavaScript APIs). Installing this add-on will allow you to unblock this feature. Please note that, when the add-on is added to your browser, it is inactive by default (toolbar icon is grey C letter). If you want to activate the add-on, please open the toolbar popup and press the toggle button on the left side. The icon will turn to an orange C letter. If you have a feature request or found a bug to report, please fill out the bug report form on the add-on's homepage (https://mybrowseraddon.com/access-control-allow-origin.html).

Vue.js devtools (beta)
DevTools browser extension for Vue.js Chrome DevTools extension for debugging Vue.js applications. Thank you for trying the Vue.js devtools Beta! If you have any issue, please report them on the GitHub repository. This is the beta channel with a brand-new re-implementation, built with Vue 3. Note the beta channel may cause conflict with the stable version of Vue devtools. If the Vue icon is lit but the Vue tab doesn't show up in devtools, please temporarily disable the stable version and re-open the page.

Apollo Client Devtools
GraphQL debugging tools for Apollo Client. Apollo Client Devtools is a Chrome extension for the open-source GraphQL client, Apollo Client. This extension has 4 main features: 1. A built-in version of the Apollo Studio Explorer that allows you to make queries against your GraphQL server using your app's network interface directly (no configuration necessary). 2. A query watcher that shows you which queries are being watched by the current page, when those queries are loading, and what variables those queries are using. 3. A mutation inspector that displays the mutations made to your Apollo Client application data. 4. A cache inspector that displays your Apollo Client cache data. You can explore the cache through a tree-like interface, and search for specific field keys and values. Code for this extension can be found at: https://github.com/apollographql/apollo-client-devtools