
lmhkmmkefopogbadhkfcaccjnaihajbh


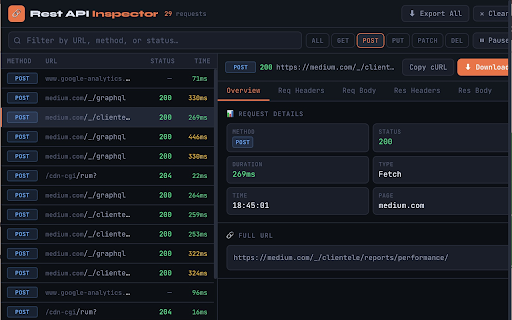

Inspect, filter and export REST API calls from any web app. View headers, payloads, timing and status. Export as HAR or JSON. Rest API Inspector — Professional API Debugging Tool for Developers =================================================================== Rest API Inspector is a powerful, lightweight Chrome extension built for frontend developers, full-stack engineers, QA testers, and anyone who needs to understand exactly what API calls their web application is making. Whether you are debugging a production issue, testing a new feature, auditing third-party integrations, or verifying that your app communicates correctly with a backend, Rest API Inspector gives you instant, clear visibility into every HTTP request — without ever leaving your browser tab. Unlike the built-in Network tab in Chrome DevTools, Rest API Inspector is designed to be fast to open, easy to navigate, and focused purely on REST API traffic. It sits quietly in your toolbar, capturing requests in the background the moment you load a page. One click on any request reveals its complete profile: method, status, duration, all request and response headers, request body, and response body — with JSON automatically pretty-printed and syntax-highlighted. Built on Chrome Manifest V3, the extension uses the absolute minimum permissions required — just tabs and activeTab. Everything is stored in memory only, never written to disk, and never sent anywhere. ━━━━━━━━━━━━━━━━━━━━━━━━━━━━━━━━━━━━━━━━━━━━ CORE FEATURES ━━━━━━━━━━━━━━━━━━━━━━━━━━━━━━━━━━━━━━━━━━━━ LIVE REQUEST CAPTURE The moment you open a web page, the extension begins capturing every outgoing API call. No configuration, no code changes. The extension patches both XMLHttpRequest and fetch() at the MAIN world level, which means it intercepts requests from the page's own code, third-party libraries, embedded widgets, and analytics scripts — anything running in that tab. IN-PROGRESS INDICATORS Requests appear instantly with a live spinner while in flight. The row updates automatically when the response arrives, showing the final status code and exact duration. This live view is useful for tracking slow requests, watching long-polling calls, or understanding the order in which parallel requests resolve. RESPONSE TIME TRACKING Every request is timed from the moment it is sent to the moment the full response is received, colour-coded for instant scanning: • Green — under 300ms (fast) • Yellow — 300ms to 1s (acceptable) • Red — over 1s (slow — investigate) HTTP METHOD BADGES Every request is labelled with its HTTP method in a colour-coded badge: • GET — green • POST — blue • PUT — yellow • PATCH — purple • DELETE — red • HEAD — cyan STATUS CODE COLOUR CODING • 2xx Success — green • 3xx Redirect — cyan • 4xx Client Error — yellow • 5xx Server Error — red ━━━━━━━━━━━━━━━━━━━━━━━━━━━━━━━━━━━━━━━━━━━━ FILTERING & SEARCH ━━━━━━━━━━━━━━━━━━━━━━━━━━━━━━━━━━━━━━━━━━━━ METHOD FILTER BUTTONS One-click buttons to show only GET, POST, PUT, PATCH, or DELETE requests. The active filter is highlighted. Switching is instant. LIVE TEXT SEARCH The search bar filters the request list as you type — by any part of the URL, by method name, or by status code. The text search and method filter work simultaneously. For example: filter to POST, then search for "auth" to find your authentication endpoint immediately. ━━━━━━━━━━━━━━━━━━━━━━━━━━━━━━━━━━━━━━━━━━━━ FIVE-TAB DETAIL PANEL ━━━━━━━━━━━━━━━━━━━━━━━━━━━━━━━━━━━━━━━━━━━━ Click any request to open its complete detail view. Five tabs cover every dimension of the exchange: OVERVIEW TAB • HTTP method, status code and text, duration, request type • Exact timestamp, source page URL • Full URL in a copyable code block REQUEST HEADERS TAB All headers sent with the request, sorted alphabetically in a clean two-column table. Includes Content-Type, Authorization, custom headers — everything. REQUEST BODY TAB The payload sent with the request, rendered intelligently: • JSON — parsed, pretty-printed, syntax-highlighted • FormData — decoded as readable key-value pairs, File entries show filename and size • URL-encoded — displayed as readable text • Binary / Blob — labelled with MIME type and byte count • Empty body — clearly labelled rather than left blank RESPONSE HEADERS TAB All headers returned by the server, sorted alphabetically. Check CORS headers, Cache-Control, Set-Cookie, rate limit headers, and any custom API response headers. RESPONSE BODY TAB The full response from the server: • Valid JSON — automatically parsed, pretty-printed and syntax-highlighted • Other text (HTML, XML, plain text) — shown verbatim • Large responses over 500KB — truncated with a note showing the original size All tabs include a hover-to-reveal Copy button so you can copy any content with a single click. ━━━━━━━━━━━━━━━━━━━━━━━━━━━━━━━━━━━━━━━━━━━━ EXPORT & SHARING ━━━━━━━━━━━━━━━━━━━━━━━━━━━━━━━━━━━━━━━━━━━━ EXPORT ALL AS HAR Saves all visible requests as a standard HAR (HTTP Archive) 1.2 file. Compatible with: • Chrome DevTools (Network tab → Import HAR) • Postman (generate a collection from real traffic) • Charles Proxy, Fiddler, WebPageTest • Any HAR viewer or analysis tool DOWNLOAD SINGLE REQUEST Saves the selected request as a self-contained JSON file including the method, URL, status, duration, all headers, request body, and response body. The filename is auto-generated from the method and URL path. COPY AS CURL Copies a complete, ready-to-run curl command to your clipboard: curl -X POST 'https://api.example.com/users' \ -H 'Content-Type: application/json' \ -H 'Authorization: Bearer eyJhbGc...' \ -d '{"name":"Alice","email":"alice@example.com"}' Paste directly into a terminal to reproduce any request — useful for isolating API behaviour or sharing a reproducible call with a backend engineer. ━━━━━━━━━━━━━━━━━━━━━━━━━━━━━━━━━━━━━━━━━━━━ RECORDING CONTROLS ━━━━━━━━━━━━━━━━━━━━━━━━━━━━━━━━━━━━━━━━━━━━ PAUSE & RESUME Freeze capture instantly. The list stops updating while existing requests stay visible. Resume with one click. Useful when you want to read through a set of requests without new ones pushing them down the list. CLEAR ALL Wipes the request list for the current tab. Use this to dismiss page-load background traffic, perform a specific user action, then inspect only the requests that action triggered — all without reloading the page. BADGE COUNTER The extension icon shows a live badge with the total request count for the active tab, updating in real time. Capped at 99+ for visual tidiness on long sessions. PER-TAB ISOLATION Each browser tab has its own independent request log. Switching tabs in Chrome automatically switches the inspector to show that tab's requests. Closing a tab permanently deletes its data from memory. 500-REQUEST ROLLING WINDOW The 500 most recent completed requests are kept per tab. Once the limit is reached, the oldest entry is dropped when a new one arrives — keeping memory usage stable during long sessions. ━━━━━━━━━━━━━━━━━━━━━━━━━━━━━━━━━━━━━━━━━━━━ PRIVACY & SECURITY ━━━━━━━━━━━━━━━━━━━━━━━━━━━━━━━━━━━━━━━━━━━━ Zero data collection. Full stop. WHAT THE EXTENSION DOES: • Stores captured requests in JavaScript memory, scoped to the current tab • Displays that data in the popup UI when you open it • Writes data to a file only when you explicitly click Export or Download WHAT THE EXTENSION NEVER DOES: • Never sends request data, URLs, headers, or bodies to any external server • Never writes anything to disk, chrome.storage, or localStorage • Never communicates with any analytics platform or third-party service • Never collects personally identifiable information • Never tracks which websites you visit or which APIs you call PERMISSIONS: • tabs — to identify the active tab and show the correct request list • activeTab — to associate captured requests with their source tab • host_permissions () — to inject the interceptor across all domains No storage permission. No webRequest permission. No background data collection. When you close a tab, all captured data for that tab is permanently gone. ━━━━━━━━━━━━━━━━━━━━━━━━━━━━━━━━━━━━━━━━━━━ WHO IS THIS FOR? ━━━━━━━━━━━━━━━━━━━━━━━━━━━━━━━━━━━━━━━━━━━ FRONTEND DEVELOPERS Debug API integration issues, verify request payloads, check headers are being sent correctly, and confirm responses match expectations — without opening DevTools. FULL-STACK ENGINEERS See exactly what the frontend sends to your backend. Compare actual payloads against what your endpoint expects. Export as cURL to reproduce calls directly against the server. QA ENGINEERS & TESTERS Verify that user actions trigger the correct API calls. Check request bodies contain the right data. Confirm status codes match the API contract. Export sessions as HAR files for bug reports. PERFORMANCE ENGINEERS Identify slow API calls instantly with colour-coded timing. Spot requests over 1 second at a glance. Export HAR for waterfall analysis. SECURITY REVIEWERS Audit what data a web application sends to external services. Inspect headers for sensitive information. Review third-party API destinations and payloads. ━━━━━━━━━━━━━━━━━━━━━━━━━━━━━━━━━━━━━━━━━━━━ GETTING STARTED ━━━━━━━━━━━━━━━━━━━━━━━━━━━━━━━━━━━━━━━━━━━━ 1. Click "Add to Chrome" 2. Pin the extension via the puzzle-piece icon in your toolbar 3. Open any website or web application 4. Click the 🔗 icon — no page reload required 5. Interact with the page and watch requests appear live 6. Click any request to inspect its full headers and body 7. Filter, export, download, or copy as cURL

API Recorder
Automatically record and export API calls from your web application… Automatically record and export API calls from your web application to Postman in seconds with our Chrome Extension. Are you tired of manually tracking and exporting API calls? Our API Call Recorder Chrome Extension simplifies your workflow by automatically capturing API interactions directly from your web application and exporting them to Postman. Save time, reduce errors, and enhance your API testing efficiency with this powerful tool. - Automatic API Recording: Instantly capture all API calls made by your web application. - Effortless Export to Postman: Export recorded API calls to Postman in just a few clicks. - Comprehensive Metadata Capture: Record URLs, headers, cookies, and request/response bodies. - Improve Testing Efficiency: Eliminate manual entry and start testing faster. - Save Time: Automate the tedious task of tracking and exporting API calls. - Increase Accuracy: Reduce errors by capturing all necessary metadata automatically. - Boost Productivity: Create Postman collections quickly and start testing without delay. - Install the API Call Recorder Chrome Extension. - Put your email to login (nothing else is required) - Visit your web application and perform your actions as usual. - Our extension will automatically record all API calls. - Export the recorded API calls to Postman in seconds. - Start testing your APIs efficiently and effectively. The users love us include: QA Engineers Software Developers API Testers Automation Engineers Get Started Today Download the API Call Recorder Chrome Extension now and streamline your API testing workflow.

API Tester - REST API Tester Client FREE
Develop, test and debug REST APIs. Welcome to API Tester - REST API Tester Client FREE a tool for developing, testing and debugging REST APIs. #1 The API Tester includes the following main functionality: 1. Send requests and display responses API Tester - REST API Tester Client FREE can handle GET, PUT, PATCH, DELETE, HEAD, OPTIONS and Custom requests. In addition custom headers and basic authentication can be added to the requests. 2. Manage favorites To make debugging life easier, the API Tester allows to store and manage favorite requests. These favorites can also be imported and exported. 3. Request history By default all requests are stored within the request history. Please rest assured that the API Tester will not store any requests made from an incognito window. 1. Which permissions are needed to use our API Tester - REST API Tester Client FREE extension? Only storage permissions are needed, these permissions are then used to store favorite and historic requests. 2. Where do I get help? The API Tester extension has a dedicated Help section which describes the most important functionality.

Request Interceptor
Request Interceptor Extension for Chrome. Request Interceptor: Native HTTP/HTTPS Traffic Manager for Chrome Request Interceptor is a developer tool that allows you to seamlessly intercept, monitor, and route network traffic directly within your browser. Core Features: - Forward, drop, or pause incoming/outgoing requests. - Modify header values and POST payload data on the fly. - Add or delete custom request headers. - Filter interceptions by specific resource types. - Export request details as JSON and browse history. What is New in Version 3.0: - Bulk Actions: Instantly "Forward All" or "Drop All" intercepted requests with a single click. - Advanced Filtering: Isolate specific request types (GET, POST, PUT, DELETE) with interactive multi-select dropdowns. - Color-Coded UI: HTTP methods now feature color badges for faster visual scanning. - Improved UX: Added confirmation dialogs for deletions, "Select All" toggles, and one-click clear buttons for search inputs. - Stability: Fixed edge cases to prevent crashes while routing headless request payloads. What is New in Version 2.0: - Upgraded the extension to the modern Manifest V3 architecture. - Added a dedicated alert page and improved error messaging output. - Refined UI copy (e.g., changing to "Save as a JSON File"). - Added titles to the History and Settings pages for better navigation. - Extension windows now close automatically when you stop debugging. - Added full support for non-Latin characters.

webQsee: Free Website Bug Recorder + Sniffer
Record, replay and analyze web app behavior. Collect and export data for trouble tickets. Capture screenshots and videos. 📸 Create a tab screenshot combined with network traffic & console logs (= Event Snapshot). 📹 Create a tab video combined with network traffic & console logs (= Behavior Report). ⇫ Export your findings as a single file or even temporarily share it via cloud - FREE of charge & without user account. 🔍 Use the webQsee DevTools for realtime-insight in a tab's network traffic and console logs. Export and import HAR (HTTP archives) besides our custom formats (Event Snapshot & Behavior Report). webQsee is privacy-centric. Data you capture with webQsee is stored LOCALLY per default and does NOT leave your system without your prior knowledge. For a more detailed list of features, visit webqsee.com