
lmcdffjpijcfeamjmldmdncejdnifgdf
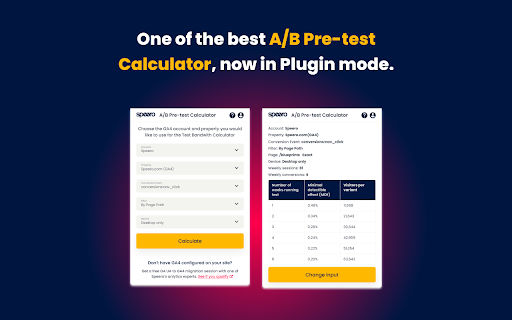
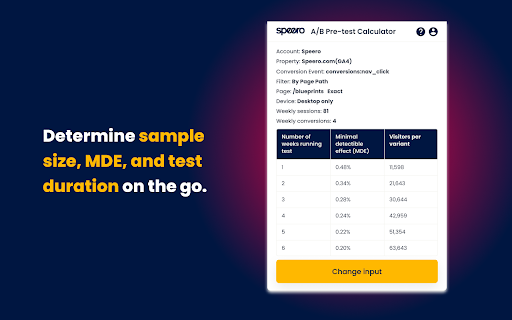

Speero's A/B Pre-test Calculator helps you answer vital pre-test questions like MDE, sample size, duration, and more. Speero's A/B Pre-test Calculator helps you answer all important pre-test questions like: — What is the minimal detectible effect I can test for? — How long should I test for considering the effect? — What's the sample size? Type in the number of weekly sessions or users, conversions, and a number of test variants, and see if your website has the capacity to test your ideas. Or just sign in with Google Analytics and let Speero’s calculator get the results for you. Speero’s A/B Pre-test Calculator is pre-defined for 2 variants (including control), confidence of 95% and statical power of 80%. One of the best A/B Pre-test Calculators, now in Plugin mode. Determine sample size, MDE, and test duration on the go. Filter By Page Path and compare pre-test data from multiple URLs. The best part is that Speero’s A/B Pre-test Calculator connects with your GA4, letting you answer all your pre-test questions without leaving the tab.

VWO
VWO plugin lets you add observations and download heat maps and scrollmap. This is a helper extension that adds to the existing capabilities of VWO Experience Optimization Platform by allowing you to add observations, download heatmaps, and prevent compatibility issues. 1. Add observations from anywhere: If you notice anything interesting on your website, quickly make a note and create an observation. The observation is saved along with a screenshot of the page and can be referred to whenever required. 2. Download heatmaps: Any heatmap can be downloaded as an image when viewed along with an improved loading experience on mobile and tablet devices. 3. Overcome compatibility issues: Visual Editor will not open in the fallback mode that may cause pages to load improperly.

Google Analytics Debugger
Prints useful information to the JavaScript console by enabling the debug version of the Google Analytics Javascript. This extension loads the debug version of the Google Analytics Javascript for all sites you browse using Google Chrome. It prints useful information to the Javascript console. These messages include error messages and warnings which can tell you when your analytics tracking code is set up incorrectly. In addition, it provides a detailed breakdown of each tracking beacon sent to Google Analytics. To use this extension, You need to follow three steps: 1. Turn it on by clicking its icon to the right of the address bar. 2. Open the Chrome Javascript console to see the messages. On Windows and Linux, press Control-Shift-J. On Mac, press Command-Option-J. 3. Refresh the page you are on. By installing this extension, you agree to the Chrome Gallery Terms of Service at https://chrome.google.com/extensions/intl/en/gallery_tos.html You can ask questions about the plugin and report bugs at analytics-extensions@google.com

Microsoft Clarity Live
Watch how people are engaging with your site - right from your site. The Microsoft Clarity Live extension helps you easily see where users engage with your site, where they get stuck, and test out new ideas. You don't have to go to a separate website or comb through columns of data to get the info you need, either. Clarity Live does the hard work for you by creating heatmaps and session recordings that you can view without leaving your site. These data visualizations make it simple to analyze engagement, optimize your design, and quickly identify and fix problems. How it works: Download the extension and set up a free Clarity account if you don't already have one. Then simply navigate to the page or specific experience you want to explore and select the heatmap, area heatmap, or session recording icon on the Clarity widget. Voila! Whichever Clarity feature you chose launches right over the page you're on. That's it. Analytics has never been so easy! Highlights Heatmaps: Clarity Live combines two types of heatmap into one view. Click heatmaps capture the most clicked (or tapped) elements on a page. Scroll heatmaps reveal the most viewed areas on a page by showing how far users scroll. Clarity Live makes it easy to see engagement for flyouts, popups, dropdown lists, and other elements that can be difficult to capture in a typical heatmap experience. Area heatmaps: Instead of visualizing engagement on the element level, these heatmaps allow you to select an area, which could contain several elements, to get the total clicks and click distribution rate. An area could include just one element or be as large as the entire page. You're in control. Session recordings: These give you a front-row seat to individual sessions. These animated renderings capture how a user explored your site, by showing you where they clicked or tapped, where they hesitated, and how they moved their cursor. Clarity Live makes it a snap to find recordings for a specific experience, too. For example, if you wanted to see how a user engages with a particular popup, you could fire the popup on your site, and select the recording icon on the widget. You would instantly see relevant recordings made within the last three days. A note on pricing: Clarity is 100% free. You'll never be asked to upgrade to a paid version. No credit card is required to sign up for a Clarity account. Learn more(https://clarity.microsoft.com/pricing) Stop guessing. Get Clarity. Happy visualizing!

dataslayer
Debug and test tag management (Google Tag Manager, DTM, Tealium) and analytics implementations. dataslayer adds a panel to Chrome Developer Tools that monitors tag management data layers and displays changes in an easy-to-read, user-friendly format. Supported TMS/variables include: - Google Tag Manager dataLayer variable - Adobe Launch rules and data elements - Adobe DTM page load rules and detection - Tealium data layer - TagCommander data layer - custom data layers (any variable represented as a JavaScript object) dataslayer supports multiple data layers / GTM containers on a single page, including those in embedded iframes. dataslayer also decodes and displays tags (including pageviews, variables, and click events) from: - Google Analytics (including App + Web, Universal Analytics / analytics.js, dc.js, and ga.js) - Adobe Analytics / Omniture SiteCatalyst - Floodlight For feature requests and bug reports, please either use the 'Send Feedback' option in the Chrome Web Store or reach out directly to info@dataslayer.org Source lives at https://github.com/sean-adams/dataslayer if you'd like to contribute!