
jbnlcgeengmijcghameodeaenefieedm
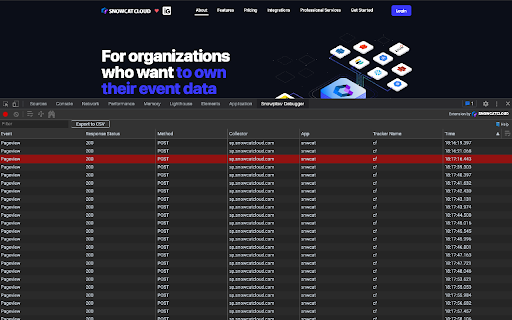


Debug your Snowplow implementation with the Snowplow Debugger in Developer Tools. If you work with Snowplow as much as we do, you know debugging is not as straightforward as inspecting hits with the network tab. Now it is!. Looking to improve developers day-to-day during implementation and quality assurance of Snowplow, we've created a Chrome extension that is both simple and intuitive to use. - Collector Override for easy debug - Event validation with detailed errors - Custom Iglu servers (including your local drive) - Rest your eyes with Chrome Dark and Light themes - Easier QA, export to CSV - See what you need, filter for any parameter v1.1.0 - August 2021 + Added red background when hits have invalid payload (against schema) + Event validation against available schema with detailed errors + Hit detail reveal IGLU repositories schema URL used for validation + Several bug fixes Please report any issues and feature requests to hello@snowcatcloud.com.

Requestly: Intercept & Modify HTTP Requests
Intercept & modify HTTP(S) traffic: redirect URLs, modify headers, inject scripts, mock REST & GraphQL APIs, and more. 🚀 Best Chrome extension to supercharge Web Development & QA. Trusted by 300,000+ developers. 👉 Requestly works directly in Chrome with beautiful, modern UI and team collaboration features. Popular features – Modify HTTP Headers, Override API Responses, API Mocking, Redirect URLs, Insert Scripts & HTTP Interceptor. 🌟 Top Use Cases → Mock API Responses to build frontend when backend isn't ready → Modify HTTP Request & Response Headers → Test local JavaScript changes directly on production sites → Use HTTP Redirect Rule to load scripts from local or staging environments on production sites → Modify and Mock API Request payload, Response body, & Status Code → Override GraphQL Requests 📌 https://requestly.com/blog/what-is-requestly Requestly (now a part of BrowserStack) doesn't set up a proxy in your browser, and hence, developers don't face VPN issues or lags while using it. Requestly leverages Chrome Extension APIs under the hood to intercept & modify requests. 👉 Redirect URLs, Change Host, Modify Query Params (Map Remote or Map Local) → Use dev/staging APIs in production sites & test local changes without code changes → Debug remote Javascript by loading locally running JS in production sites → Switch Hosts (e.g. abc.com/* to xyz.com/*) using Replace Rule → Debug Ad Tracking Pixels, Debug A/B Test Campaigns, etc → Remote Debugging with Requestly on Production sites → Swap Adobe Launch (Adobe DTM) scripts in production with staging script 📌 Demo Video – https://www.youtube.com/watch?v=85GVaOWTnlE 👉 Insert Scripts to any Webpage → UserScripts are simple JavaScript/CSS code that can change the layout of a page, add or remove new functionality and content, or automate actions. → Use File Server to upload long scripts and Inject them using Script Rule → Inject your JS tags on potential customers' sites and test your features → The sales/product team can use this to demo the product directly on the prospect's website (10x engaging demo) 📌 Demo – https://www.youtube.com/watch?v=4dvucRjLwGY 👉 Requestly supports the following imports → All HTTP header profiles from ModHeader → JSON configuration for Redirects & Scripts from Resource Override → XML configuration from Charles Proxy (Map local isn't supported in chrome extension yet due to technical limitations in browser) 👉 Additional Features → Enable/Disable rules with a single click → Export and import the rules and maintain a backup for your rules → Easy collaboration with others. Share Rules with other Users in one click 📌 Demo – https://www.youtube.com/watch?v=BM7kTFy-vdc

ObservePoint Debugger
Troubleshoot analytics tags, variables, events, cookies, and more. Supports Adobe Analytics, Google Analytics, and thousands more. Now with GPC, Accessibility Scanning, and a dedicated Cookies tab! Easily audit page accessibility, and view, search, and manage all browser cookies—the perfect all-in-one replacement for niche debugging tools. Overview ObservePoint’s Debugger is a free Chrome Extension for troubleshooting analytics, marketing tags, cookies, and web accessibility directly in Chrome DevTools. It captures page-load and event-triggered requests, parsing them into a clean, human-readable format for easy debugging and compliance checks. Key Features 🔹Simulate GPC Signals Instantly: Validate and compare tag and cookie compliance with Global Privacy Control (GPC) enabled directly inside the extension, eliminating the need for separate browser plugins or manual header workarounds. 🔹Accessibility Testing: Instantly scan any page for WCAG compliance issues. Identify errors in color contrast, ARIA labels, heading structures, and more to ensure an inclusive user experience. 🔹Cookies Tab: Quickly inspect all browser cookies in one place—including those set by tags and scripts. Filter and sort by name, value, domain, path, and expiration to understand privacy implications. 🔹Tag Inspection: See exactly what data is being sent to your analytics and marketing platforms in real-time. Why Use ObservePoint The Debugger is the first step toward comprehensive governance of your digital properties. The full ObservePoint platform helps you: 🔹 Audit Accessibility: Scan entire domains for WCAG 2.1/2.2 compliance. 🔹 Monitor Data Accuracy: Scan pages or user flows to ensure tags fire correctly. 🔹 Protect Privacy: Identify and categorize cookies set by third-party scripts. 🔹 Test Pre-Release: Validate implementations in dev and staging environments. 🔹 Automate Quality: Get alerts when tracking, compliance, or critical paths fail. How It Works After installation, open Chrome DevTools → ObservePoint tab → Refresh the page. See which tags, cookies, and accessibility violations appear, including: 🔅 Accessibility Health: Details of WCAG errors and warnings. 🔅 Tag Details: Name (GA4, Adobe, OneTrust), Account ID, and Category. 🔅 Tag Performance Metrics: Status, Request Size, and Latency. 🔅 Cookie Intelligence: Expiration dates and source attribution. Click any item to view variables, decoded request data, or specific remediation guidance for accessibility errors. Export your findings as an Excel file for easy sharing. Get Started The ObservePoint Debugger is a powerful alternative to WASP, OmniBug, Accessibility Insights, or Tag Inspector. 1. Enable the extension under Chrome → More Tools → Extensions. 2. Open DevTools (Ctrl+Shift+I / Cmd+Opt+I). 3. Select the ObservePoint tab. 4. Refresh your page. For cookies and accessibility, no refresh is required. 5. Start debugging! By installing, you agree to the ObservePoint Terms of Service: https://www.observepoint.com/service-agreement/ Learn more: https://help.observepoint.com/en/articles/9113174-observepoint-debugger-chrome-extension

dataslayer
Debug and test tag management (Google Tag Manager, DTM, Tealium) and analytics implementations. dataslayer adds a panel to Chrome Developer Tools that monitors tag management data layers and displays changes in an easy-to-read, user-friendly format. Supported TMS/variables include: - Google Tag Manager dataLayer variable - Adobe Launch rules and data elements - Adobe DTM page load rules and detection - Tealium data layer - TagCommander data layer - custom data layers (any variable represented as a JavaScript object) dataslayer supports multiple data layers / GTM containers on a single page, including those in embedded iframes. dataslayer also decodes and displays tags (including pageviews, variables, and click events) from: - Google Analytics (including App + Web, Universal Analytics / analytics.js, dc.js, and ga.js) - Adobe Analytics / Omniture SiteCatalyst - Floodlight For feature requests and bug reports, please either use the 'Send Feedback' option in the Chrome Web Store or reach out directly to info@dataslayer.org Source lives at https://github.com/sean-adams/dataslayer if you'd like to contribute!

Tealium Tools
Evaluate website data, tags, and events with powerful tools for seamless Tealium iQ integration and server-side enrichments. Access quick links to documentation, training, and support, along with a catalog of custom tools built by the community. Improve your Tealium implementations with features like Web Companion for data layer validation, Server-side Trace for real-time action debugging, and Environment Switcher for seamless testing. Additional tools for troubleshooting, real-time interaction, and comprehensive testing ensure efficient, error-free setups. NEW FEATURES in V3: - New Side Panel Support - SSO Login - Click-and-Hold to Custom Sort - Built-in Feedback form 🔍 | Web Companion Easily inspect and validate your website's data layer, including cookies, JavaScript variables, and other critical elements. Fully integrated with Tealium iQ, Web Companion allows you to evaluate tags, extensions, and load rules directly on your web pages. 🎯 | Server-side Trace Monitor and debug your audience segmentation and real-time actions with Trace. Ensure the accuracy of visitor attributes, segment updates, and action firing to refine your digital marketing strategies. 🔄 | Environment Switcher Seamlessly switch between development, QA, and production environments within Tealium iQ to test and validate tags before deployment, ensuring error-free implementations across your digital properties. 🛠️ | uTag Debugger Diagnose and troubleshoot your Tealium iQ Tag Management setup with real-time logs that display tag execution and data layer interactions, ensuring accurate and efficient tag deployment. 💡 | Custom Tools Build complex and rich apps for the Tealium ecosystem. Custom tools allow you to run JavaScript on the current page, similar to an advanced bookmarklet, enabling you to gather data and create powerful, tailored tools for your specific needs. ➔ Real-Time Interaction: Make adjustments instantly with immediate feedback within your browser. ➔ User-friendly interface: Simplifies complex processes, making it accessible for both technical and non-technical users. ➔ Comprehensive Testing and Debugging: Provides tools for thorough testing and validation to ensure reliable performance and accurate data collection.