
ideeaicjegejlmejdjbhbhfhenekneie
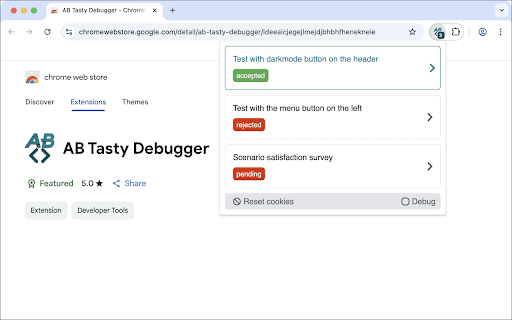


Browser extension that simplifies the debugging of A/B tests from AB Tasty and adds useful informations. Display A/B tests available on the current page and detail their informations such as variations and trackings and targetings. For example, if a test does not display, the extension displays the current variation and invalid targets. - Dark mode compatible (user preference media feature). - Displays a badge with the number of A / B tests found on the current page. - Displays a list of all A/B tests available on the current page with their status. - The list of A/B tests is sorted to show the accepted tests at the top of the list. - Displays a clear AB Tasty cookies button to clear AB Tasty cookies and reload the page. - Displays a debug mode button to activate AB Tasty logs in the DevTools console. - Displays a detail view of each tests with their general informations (ID, status, type, targeting mode, async, traffic). - Displays a link to see the test report. - List all variations of the test if the status is `accepted` or `traffic_rejected`, with their name, traffic, a link of JSON modifications and activation button. - List all trackings information of the test with their name and selector. - List all targeting information of the test (segment, trigger, URL, code, selector, cookie, IP) with their status. - Displays a link to edit the test targetings on the AB Tasty editor. - The list of targeting is sorted to show the invalid targets at the top of the list. - Collapse/expand all variations, trackings and targetings information.

Glassbox Extension
Streamline your digital analytics workflows by working directly on your live website. This browser extension enables you to perform a variety of activities directly on your live website, providing a seamless and intuitive enhancement of the Glassbox console's capabilities. The extension allows you to: 1. Analyze user engagement: Overlay an Interaction Map on any webpage within your browser to analyze users' interactions with that page. As you navigate to other pages, the extension seamlessly updates to display Interaction Maps for each. To get started, from the Glassbox console, click GB Live on the Interaction Maps screen. 2. Define new application entities: Simply click on screen elements within your website directly through your browser to create new client attributes. To get started, from the Glassbox console, click New Client Attribute on the Management > Attributes screen. (This extension replaces the Glassbox Builder extension which supported client attribute capture only.)

Analytics Debugger
Your Single Source of Truth (SSOT) for debugging analytics implementations Formerly known as "GTM/GA Debugger," our tool is your ultimate Single Source of Truth (SSOT) for debugging analytics implementations! Are you a developer, analyst, or marketer committed to achieving top-tier web analytics and tracking results? Look no further! Our powerful debug tool is meticulously crafted to simplify your life. Analytics Debugger streamlines your daily debugging tasks, boasting user-friendliness for all while delivering in-depth insights to advanced users. v2.4.6 - Adds support for Chartbeat - Fixed Amplitude Regional Collection Endpoints 🛠️ Wide Compatibility: Our tool seamlessly supports a variety of analytics and tracking tools, including: - Google Tag Manager - Google Analytics - Tealium - Piwik Pro / Matomo - Adobe tools - and most commonly used Marketing Pixels. to mention some of them (Check the full list here) 🔒 Privacy Enhancement: Rest assured, our tool injects code only after DevTools has loaded, with no background monitoring. 🚀 Tools: Supercharge your tracking implementation with a rich toolkit including - GTM Preview Enhancer: USe this tool to bypass all the limitations from the original Preview Mode - Google Analytics Debug Libraries Loader - Block GA3/GA4 Hits: Prevent your - Export Features - Real-Time Data - Enhanced Ecommerce Reports - Data Filtering for Focused Insights - Clicks Blocker: Prevent being redirected to next page - and much more! Get started today and elevate your analytics debugging and optimization process effortlessly. Unlock the full potential of your analytics and tracking endeavors – streamline your workflow, enhance privacy, and gain profound insights seamlessly. Download now and experience the transformation! Changelog: You can check out our latest updates on our GitHub repository. https://github.com/analytics-debugger/analytics-debugger-browser-extension Support / Feedback: Offered via the Store or using the Github Repository Official Documentation: For detailed guidance, visit our official documentation at https://www.analytics-debugger.com/tools/browser-extension Don't miss out on this game-changing tool. Elevate your analytics game today!

CRO Toolbox
A/B switcher, Datalayer reader, test analyser, MDE calculator & SRM checker for Convert.com, VWO, Varify, Kameleoon, Optimizely CRO Toolbox is a Chrome extension for CRO consultants, online marketers, and anyone involved in A/B testing. It opens as a side panel next to the website you're working on and gives you a set of tools to support your testing workflow — from QA on live sites to planning and analysing experiments. It’s designed to stay open while you browse, so you can inspect experiments, track events, and run calculations without constantly switching tabs or re-opening popups. What’s included A/B Switcher — rebuilt from the ground up Quickly inspect and switch variants for running experiments directly on the page you’re viewing. Shows experiment names and variant names instead of just technical IDs, so it’s much easier to know which test you’re looking at. Detects when something is a live deployment rather than an actual A/B test, so you won’t accidentally try to switch to a variant that doesn’t exist. Supports multiple experimentation platforms and handles common implementation quirks. Kameleoon support — detects and switches variants for experiments running on Kameleoon, including cookie-based assignment and experiment discovery from the Kameleoon JavaScript object. Optimizely Web support — full support for Optimizely Web experiments, including detection via the Optimizely data object, variant switching, and forced activation. VWO, Convert.com & Varify — detection and experiment-handling logic for all three platforms has been overhauled for reliability. Handles edge cases around async script loading, anti-flicker snippets, and multi-experiment pages more robustly. Currently supports Convert.com, VWO, Varify, Kameleoon, and Optimizely Web. DataLayer Reader — real-time event inspection Inspect every event pushed to the dataLayer in real time while you browse. Live streaming view — see new events as they’re pushed, without refreshing the page. Automatic grouping — events are grouped into GTM, Ecom, GA4, and Others tabs so you can cut straight to the signals that matter without scrolling through noise. Smart tagging — automatic tagging for GA4, ecommerce, and GTM events. Filtering & grouping — filter by keyword, group events by type, and keep a per-page history so you can see exactly what fired where. Ideal for QA’ing tracking before, during, and after a test. A/B Analyzer — significance, explained clearly Paste in your visitors and conversions and get a clear, practical interpretation of your test results. Choose between two analysis approaches depending on how you like to work. See the probability that your variant is winning. Get the expected uplift and a plain-language interpretation of the result so stakeholders can understand the outcome without statistical jargon. MDE Calculator — minimum detectable effect Understand what size of impact your test can realistically detect. Calculates the smallest improvement your test would be able to reliably detect, week by week, based on your site traffic. Helps you decide how long to run a test before the results are meaningful. Useful for planning realistic expectations with stakeholders and avoiding underpowered tests. SRM Checker — Sample Ratio Mismatch detection Check whether your test traffic was actually split as intended. Paste in your visitor counts per variant. Get an instant verdict on whether there is a Sample Ratio Mismatch (SRM). See a per-variant breakdown so you can diagnose issues with traffic allocation that might make results unreliable, even when the headline numbers look promising. Sample Size Calculator — plan before you test Figure out how many visitors you need per variant before you start a test. Estimate the required sample size per variant based on your baseline rate, expected uplift, and desired confidence. Helps you avoid ending a test too early or running it much longer than necessary. Aligns expectations with stakeholders on timeline and traffic requirements. Kameleoon support added — variant detection and switching for Kameleoon experiments, including cookie-based assignment and discovery from the Kameleoon JavaScript object. Optimizely Web support added — full support for Optimizely Web experiments, including detection, variant switching, and forced activation. VWO, Convert.com & Varify detection overhauled — more robust handling of async script loading, anti-flicker snippets, and pages with multiple experiments. DataLayer Reader improved — events are now automatically grouped into GTM, Ecom, GA4, and Others tabs so you can focus on the events that matter most. CRO Toolbox was previously known as A/B Experiment Variant Switcher, but has grown well beyond simple variant switching. The new name reflects its broader scope as an all-in-one side panel for A/B testing workflows.

AB Emotions AI
Extension allowing to visualise the different variations of a website for different Emotions AI segments Emotions AI adapts your content to the personality of each visitor in real time. With this plugins, you will be able to test a segment / user experience needs in order to review your personalized website.