
holcbbnljhkpkjkhgkagjkhhpeochfal

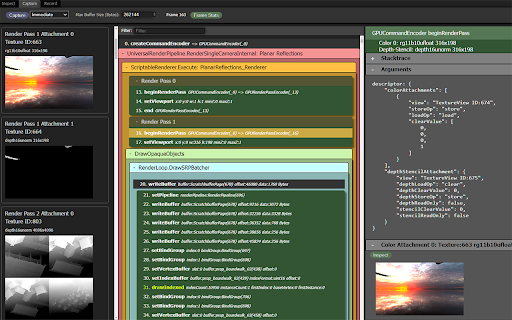

DevTools debugger and profiler for WebGPU — inspect objects, capture frames, edit shaders live, and analyze GPU performance. WebGPU Inspector is the extension for debugging and profiling WebGPU applications — RenderDoc-style graphics debugging, right inside Chrome DevTools. 🔍 Inspect • Browse every live WebGPU object with full details and the stack trace showing exactly where it was created. • Plot frame times and GPU object counts over time to track performance. • Texture viewer, look at individual pixel values. • Edit shaders live on the page to test and fix changes without reloading. 🖼️ Capture • Capture one or more frames with all of their commands, buffers, textures, and render pass results. • Auto-inject render and compute pass timestamp queries to measure performance and identify bottlenecks. • Debug shaders (experimental, compute only for now). Step through shader execution, watching variable values. • Save and reload captures, open in multiple tabs or windows, useful for A | B analysis. 🔵 Record • Record the commands and data for a set of frames and export a standalone HTML or binary file that reproduces the render anywhere — perfect for bug reports and regression tests. • Play back the recorded frame, with the ability to step through the commands to render up to that point. • Edit and disable commands in the recording to help investigate rendering issues.

GPUBot
Rent GPU & CPU Power And Start Earning The first ever browser extension-based GPU and CPU lending and renting platform. Inspired by the success of outperforming DeFi tokens such as $GPU, and catering to the popularity and needs for AI, the team behind $GPUBot has developed a Telegram-based platform offering Nodes-as-a-Service and Servers-as-a-Service. With just a few clicks in our proprietary Telegram DApp, you can buy and manage Nodes or Services with an extensive range of options/configurations. Moreover, we utilize a revenue sharing program in which all revenues generated by our platform are distributed to holders. With our offering, we play into the recent momentum of two key aspects in DeFi - Decentralized Physical Infrastructure Networks and Telegram-based tools, both of which will be touched upon in the next paragraphs.

webgpu-devtools
WebGPU devtools for debugging WebGPU applications WebGPU devtools is a web browser extension that helps debug WebGPU applications. It captures WebGPU usage. You can check for example - Created WebGPU objects - WebGPU command history and callback - Error WebGPU commands - WGSL shader code - Buffer, texture, and framebuffer contents The WebGPU devtools is still in the alpha stage. I'm happy if you send any bug reports or feature requets.

Spector.js
Explore and Troubleshoot your WebGL scenes easily. Spector is a tool aim to WebGl developers willing to know what happens on their context. It enables capturing all the available information from a frame. You will be empowered to look at your entire commands list with their associated visual states and context information. You will be able to Explore and Troubleshoot your WebGL and WebGL2 scenes easily. This is compatible with any WebGL capable browser and all the web based 3d engines as well as vanilla scripts.

Is it WebGPU?
Extension that lets you know when a page is using WebGPU Simple extension that puts an icon in your browser which lights up when a page is using WebGPU and offers some simple stats about it's usage (How many adapters have been requested, how many devices, etc.) Unlikely to be useful for anyone outside of the Chrome GPU team.