
gkmdjmmdamjcmlhaakmlnfjldciojbjf
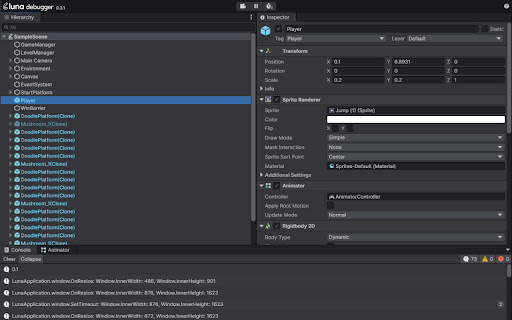
Debug Luna Playable develop builds in the browser The Luna Debugger is a powerful tool that allows developers using Playable Plugin to inspect and debug develop builds directly in the browser. The interface will be familiar to users of the Unity Editor, we've incorporated similar components like hierarchy and inspector panels so that you can debug a Playable Plugin build in real time just as easily as you would a Unity scene. How to get started Install the Luna Debugger Chrome extension from the Chrome Web Store Open a Playable Plugin develop build in Chrome Use the keyboard shortcut Option + ⌘ + I (on macOS), or Shift + CTRL + I (on Windows/Linux), to open the Chrome DevTools panel At the furthermost right of the DevTools tabs you should now see Luna, click this to open the debugger Once the Luna Debugger is displayed in DevTools, you should see the hierarchy and inspector panels populated with information related to your scene in the develop build. What youre seeing is a live representation of your builds object hierarchy in the Luna engine. Additionally, most of what you see in the inspector panel is editable in real time and we provide tools to move freely around the scene and pause it. Hierarchy Panel Here you can see the full hierarchy of all game objects in your exported build, you can click game objects to open them in the inspector panel and expand child objects. The hierarchy panel is useful for a number of reasons whilst debugging your build: Determining whether a game object is instantiated and active in the scene Determining whether a game object is a prefab Inspector Panel This is where youll find the values and attributes that apply to a game object in your scene. All the fields displayed in this panel are editable and any resulting changes can be observed instantly in the running scene. Viewing and editing game objects here can useful for the following reasons: Activating disabled game objects Changing the position, rotation and scale of an object

Bubble Buddy
Bubble Buddy allows you to quickly add/remove the debugger, reveal an element in Elements tree, start/edit a workflow, switch between live and test versions of Bubble Editor, and App pages by using *Keyboard Shortcuts* Use the following 8 Keyboard Shortcuts to make the desired changes: 1. To add/remove “debug_mode” to the page URL, use “Ctrl + M” (or click on the Bubble Buddy extension icon) 2. To reveal an element in Elements tree, a) Select an element of your choice and then b) Use "Ctrl + Shift + E" 3. To start/edit a workflow on an element, a) Select an element of your choice b) Use "Ctrl + Shift + F" 4. To switch between live and test versions of your app pages, use “Ctrl + Shift + L” 5. To switch between live and development versions of your Bubble Editor, use “Ctrl + Shift + K” 6. To select first parent of an element, a) Select an element of your choice b) Use "Ctrl + Shift + Y" 7. To open app's Backend Workflows page in a newtab, use "Ctrl + Alt + B" - With Bubble Buddy sidepanel, you can organise all your URLs (Bubble Editor, App preview pages, any resource links) and Branches linked to your Bubble Projects at one place. - "Toggle Sidepanel" shortcut will work only on Bubble Editor pages. For Bubble Buddy tutorials, checkout this playlist: https://www.youtube.com/playlist?list=PL4YOHwiJinHt3S7Y7TOLxIj2lvcE776O- - - - - - - - - - - - - - - - - - - - - - - - - - - UPDATES: v2.4: - Bug fixes Version 2.0: - Open Backend Workflow in newtab shortcut - Show/Hide Buddy Buddy sidepanel shortcut - Organise your Bubble projects' related URLs and Branches [Demo Version] - Added shortcuts support to apps on Bubble Dedicated instances (suggested by Andy Kalati - @akalati)

Three.js DevTools
Developer tools extension for Three.js A browser extension for inspecting three.js scenes and renderers within the page. It allows examination of object hierarchies, material properties, textures, and renderer settings.

RO app companion plugin
Plugin for mass creating Orders, Assets, Leads from lists and for changing status of orders. This application helps RO app (ex RemOnline) users to create orders for assets bundle and to make mass changes to order statuses. If you need to sort and diagnose many devices - this plugin allows create orders in the RO app system from a simple Assets list. If you have 50 ready-made products and you need to set the status "Ready" in 50 orders - with the help of this extension, you can scan serial numbers in the input window or just input list or order numbers, and by pressing one button, set a new status in open orders with these devices.

cc-inspector
Debug Cocos Creator Games with easy, display node trees and node properties, it works with both Cocos Creator v2 and v3 可视化显示 Cocos Creator 游戏的节点树、节点的组件属性,调试Cocos Creator游戏的利器🗡️ ! 😍完全免费💻开箱即用💯支持所有 Cocos Creator 版本👀支持DrawCall分析👍支持iframe嵌套😘用户好评不断! ❤️如果你喜欢该插件,请分享给你的朋友! 💁♂️作者本人也在使用,迭代频繁,更新有保证! 🎁如果可以,在 Cocos Store 支持我一下: https://store.cocos.com/app/detail/2002 🍉插件特色: 1️⃣快速拾取鼠标点击位置的节点,使用起来极度丝滑。 2️⃣普通节点和预制体节点颜色区分,方便观察节点结构。 3️⃣高亮显示鼠标滑过、选中的节点,拾取目标节点更方便。 4️⃣支持模糊搜索节点,按照路径搜索节点,查找节点更灵活。 5️⃣如果组件中引用了节点,支持在节点树中高亮显示引用,定位节点更简单。 6️⃣支持在控制台快速打印节点、组件,方便观察节点全貌。 7️⃣支持设置快捷键,绑定常用操作。 🚀更多完整功能:https://mp.weixin.qq.com/s/3A9Wv7AxrQZuumsvWpax0A 🧙♂️Cocos论坛: https://forum.cocos.org/t/topic/164888 🏠插件官网: https://tidys.github.io/cc-inspector-chrome/inspector.html 📺BiliBili: https://www.bilibili.com/video/BV1jzcHeSEh3/ 📺YouTube: https://www.youtube.com/watch?v=ajMz3zEFTA8 ----------------------------------------------------------------------------------------------------------------------------------------------- Visualize and Debug Cocos Creator Games 🗡️ 😍 Completely free 💻 Ready to use out of the box 💯 Supports all Cocos Creator versions 👀 Includes DrawCall analysis 👍 Works with iframe embedding 😘Loved by users worldwide! ❤️ Share with your friends if you enjoy it! 💁♂️ Actively maintained by the author with frequent updates. 🍉Key Features: 1️⃣ Pick nodes quickly by clicking — smooth and intuitive. 2️⃣ Distinguish normal and prefab nodes with different colors for easy visualization. 3️⃣ Highlight nodes on hover and selection for easier inspection. 4️⃣ Fuzzy search or search by path to find nodes quickly. 5️⃣ Highlight referenced nodes in the tree for easy location. 6️⃣ Print nodes and components in the console for full inspection. 7️⃣ Customize shortcuts for your most-used actions.