
ejdnjekdoemmcaaaoofkijikbmcfpgfn
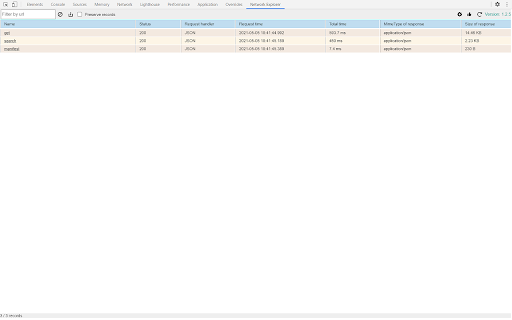

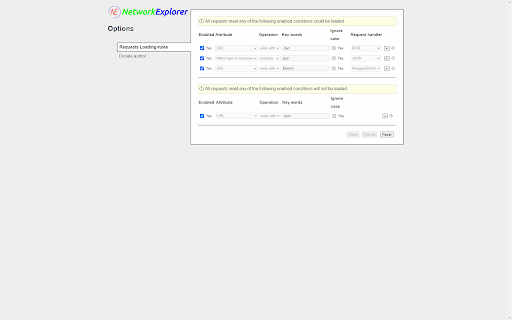
A DevTools extension to interpret network requests in real time within a friendly way. A DevTools extension to interpret network requests in real time within a friendly way. Main functions: 1. Network requests could be manually / automatically loaded into the extension. 2. Users could define custom filters to load requests they want. 3. It could display these requests in a table. 4. It could transform headers and contents of requests/responses into JSON object and display them as tree-like structures. Currently version only supports pure JSON requests and dwr request. 5. In these tree-like structures, users could copy, download and search nodes. 6. Jsonlizable strings could be detected automatically and show up in popups.

Virtual Power Networking
Connect with your most trusted contacts. Virtual Power Networking allows tribe members to connect and introduce each other on LinkedIn. This app is a tool that facilitates connections, introductions, and conversations between entrepreneurs. This fantastic application is powered by the original My Most Trusted application and is available free of charge to all the members of Marc Jarrett’s network.. The extension makes it incredibly easy for entrepreneurs to keep track of their trusted ‘inner circle’ connections. It also facilitates continued conversation between trusted connections - making it easy to build relationships, keep in touch and share valuable resources and information. It also facilitates introductions between trusted connections - assisting entrepreneurs in giving and getting introductions, referrals and connections. There is no easier way to keep track of your inner circle. And no easier way to facilitate messaging and conversation, as well as introductions and referrals between entrepreneurs. This app is a game changer because it facilitates the “Coffee First, Business Later” culture of this network in a way that is easily managed and maintained and wildly productive. If you’re still struggling with finding enough connections to sustainably grow your access to opportunities, this app is for you. It will assist you with filling your pipeline with virtual coffee’s with entrepreneurs from all over the world - ensuring that you keep talking, having coffee, and growing your business, in a sustainable manner. Coffee with entrepreneurs make the world go round. So book yours today using Virtual Power Networking powered by My Most Trusted.

Network Inspector
A Chrome extension to inspect network requests. Network Inspector is a powerful and user-friendly Chrome extension designed to help you monitor, analyze, and debug network requests in real-time. Whether you are a web developer, designer, or tech enthusiast, Network Inspector provides the insights you need to understand how web pages load and interact with servers.

Net logs
What you get: 🔍 One-click filters — Filter by exact URL, route, or wildcard (no fragile text queries). ⛰️ Framework state — View Next.js/Nuxt state that Network can’t surface. 🎨 Protocol-aware views — JSON-RPC and GraphQL parsed and visualized. 📡 Readable WebSockets — Parsed, beautified frames for real-time inspection. ✨ Portable logs — Import/export a compact '.netlogs.zip' (skip giant HARs). 🖼️ Inline media — Images and audio render inline for quick checks. 🤝 Team-friendly — Share small logs for faster reviews and bug reports. Where it lives: Implemented directly in DevTools as the “📜 Net Logs” tab for Chromium-based browsers.

Network Request Analyzer
Analyzes the timing of all network requests on the current page 🚀 Network Request Analyzer – Gain Full Visibility into Web Requests! Network Request Analyzer is a powerful Chrome extension designed for developers, performance engineers, and data analysts. It provides real-time insights into all network requests on the current webpage, helping you optimize loading speed, troubleshoot performance bottlenecks, and improve overall web efficiency. 🔍 Key Features: ✅ Comprehensive Network Request Analysis – Capture and analyze all HTTP/HTTPS requests, including DNS lookup, TCP connection, TLS handshake, request wait time, and response time. ✅ AI-Powered Performance Insights – Get intelligent recommendations and optimization suggestions using advanced AI analysis of your network requests. ✅ Visualized Timing Breakdown – A clear timeline view helps you understand request concurrency, blocking points, and load sequences. ✅ Performance Bottleneck Detection – Identify slow requests and optimize resource loading order for a faster browsing experience. ✅ Multiple AI Providers Support – Configure your preferred AI model (OpenAI, Anthropic, Deepseek) for detailed performance analysis. ✅ Downloadable Reports – Generate and download comprehensive performance reports to share with your team. ✅ A Must-Have for Web Performance Optimization – Ideal for tuning CDN, lazy loading, prefetching, and other front-end performance strategies. ✅ Real-Time Monitoring Without DevTools – Get instant insights into network activity without opening Chrome Developer Tools, making analysis more efficient. 🎯 Why Install It? For Frontend/Backend Developers – Optimize API response times, debug latency issues, and enhance rendering performance with AI-suggested improvements. For SREs & DevOps Engineers – Analyze network performance, detect slow queries, and eliminate network bottlenecks using intelligent pattern recognition. For Data Analysts – Understand the loading sequence of different resources and refine data transmission strategies with AI-driven recommendations. For General Users – Monitor page load speeds and identify slow resources that affect browsing experience. 📥 Install Now & Take Control of Your Web Performance! With Network Request Analyzer, you can effortlessly inspect all network requests with detailed timing data and get AI-powered optimization insights—making web performance tuning easier and more intuitive!