
cjdmhjppaehhblekcplokfdhikmalnaf

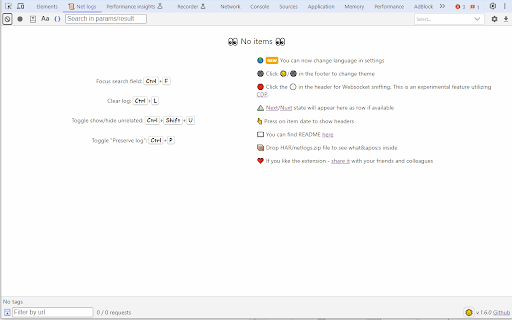
What you get: 🔍 One-click filters — Filter by exact URL, route, or wildcard (no fragile text queries). ⛰️ Framework state — View Next.js/Nuxt state that Network can’t surface. 🎨 Protocol-aware views — JSON-RPC and GraphQL parsed and visualized. 📡 Readable WebSockets — Parsed, beautified frames for real-time inspection. ✨ Portable logs — Import/export a compact '.netlogs.zip' (skip giant HARs). 🖼️ Inline media — Images and audio render inline for quick checks. 🤝 Team-friendly — Share small logs for faster reviews and bug reports. Where it lives: Implemented directly in DevTools as the “📜 Net Logs” tab for Chromium-based browsers.

JSON RPC Chrome Viewer
JSON RPC requests Chrome developer tools viewer. More convenient way to manage your rpc requests. JSON-RPC Chrome Viewer developer tool allows you to manage JSON-RPC requests in more convenient way. It includes a lot of features to make your life as developer easier and more comfortable. Resizable panes, WebSockets support, resend request feature, background requests accumulation, filtering, preserve log settings, dark and light themes, keyboard requests navigation, url label for each method, CORS badge, expand/collapse JSON tree, converting the response to TypeScript types and others. You are welcome to make feature requests, bug reports and pull requests.

Receptor
Intercept and modify fetch/xhr requests and responses on browser Receptor helps you intercept, inspect, and modify fetch and XHR requests and responses directly in Chrome, making it easier to debug APIs, test frontend behavior, and simulate backend changes without touching server code. Built for developers, QA engineers, testers, and API integrators, Receptor gives you fine-grained control over browser network traffic in real time. You can update request headers, response headers, request bodies, response bodies, query parameters, status codes, and delays using flexible matching rules based on URL, HTTP method, and other request details. Receptor is useful for API testing, frontend debugging, mocking responses, validating error handling, simulating alternate server behavior, and testing edge cases before release. Instead of changing your backend or setting up a separate proxy, you can modify live browser traffic directly where your application runs. What you can do with Receptor: - Intercept and modify fetch and XMLHttpRequest traffic - Edit request and response headers - Replace or update request and response bodies - Rewrite query parameters before requests are sent - Change response status codes - Simulate delayed responses and test loading states - Organize rules with scenarios and groups - Import and export local configurations - Create advanced request and response transformation workflows Receptor is designed for modern web development workflows and is especially helpful when working with SPAs, REST APIs, internal tools, staging environments, and frontend-heavy applications that rely on dynamic network requests. - Debug API integrations faster - Test frontend changes without backend deployment - Simulate success, error, and edge-case responses - Validate request payloads and headers - Reproduce bugs caused by specific API responses - Improve QA and regression testing in the browser If you need a flexible browser extension for request interception, response modification, API debugging, frontend testing, and network mocking, Receptor gives you a practical way to control fetch and XHR traffic directly inside Chrome.

Network explorer
A DevTools extension to interpret network requests in real time within a friendly way. A DevTools extension to interpret network requests in real time within a friendly way. Main functions: 1. Network requests could be manually / automatically loaded into the extension. 2. Users could define custom filters to load requests they want. 3. It could display these requests in a table. 4. It could transform headers and contents of requests/responses into JSON object and display them as tree-like structures. Currently version only supports pure JSON requests and dwr request. 5. In these tree-like structures, users could copy, download and search nodes. 6. Jsonlizable strings could be detected automatically and show up in popups.

Network Inspector
A Chrome extension to inspect network requests. Network Inspector is a powerful and user-friendly Chrome extension designed to help you monitor, analyze, and debug network requests in real-time. Whether you are a web developer, designer, or tech enthusiast, Network Inspector provides the insights you need to understand how web pages load and interact with servers.