
camhbggldedhfjbjabcndiggmpfghkdp
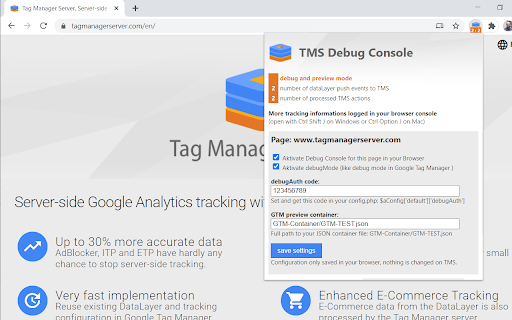


Extension for TMS debug mode This extension only works in combination with the Tag Manager Server (v0.4.0) Tracking setup. It is used to analyze all server requests to and from the TMS. With the TMS Debug Console you can view all dataLayer Push events and executed server tags. TMS Debug Console (chrome extension) 1. Download this Chrome extension from chrome web store: 2. Set the debugAuth code in your config.php: $aConfig['default']['debugAuth'] = '...'; 3. Navigate to your Page with TMS implementation 4. Open the TMS Debug Console Settings with a click on the extension icon - Set the same authCode as before - Activate Debug Console and debugMode if needed - Test new container from your server The coloured background of the numbers shows the status of the current server-side tracking: - grey: inactive Debug Console - green: Browser console logs activated - orange: activated debug mode - purple: container preview - red: invalid debugAuth code or TMS error The two numbers show: - Tag Manager Server Input shows the submitted data from the browser to the TMS API. - Tag Manager Server Action shows the server request of the TMS via the measurement protocol to Google Analytics Browser console output Once you have activated the Debug Console with the appropriate debugAuth code, the browser console will display the most important tracking information. Like this extension the whole server-side tracking solution is still in beta stage. You can find more information on our website.

TagHound - Analytics/GTM/Pixel Debugger
Debug Google Analytics, Google Tag Manager dataLayer, Google Ads, Facebook Ads & +18 ad platforms pixels: Twitter, TikTok and more TagHound Analytics/GTM/Pixel Debugger by Assaf Trafikant helps you validate your analytics tools implementation as well as ad platforms pixels and Google Tag Manager dataLayer events - all in one tool. It works all the time for all the supported platforms at once. In total, TagHound Analytics/GTM/Pixel Debugger supports 22 analytics and ad platforms, including Google Analytics 4 (and older versions) & Google Tag Manager (events and dataLayer viewer), to give you a holistic tracking and pixel analysis experience. Just navigate to any page, open your DevTools panel (F12), or click the extension icon (less information) and it will show you all your pixels and events, with a never-seen-before error validation (over 1200 validation rules). Just click the event to see all the data in a clear format, grouped by attributes. TagHound Analytics/GTM/Pixel Debugger allows you to group events by type, performance and attributes. You can RECORD your debugging activity while navigating through any website and even export the results. TagHound Analytics/GTM/Pixel Debugger his all-in-one tool, giving you a clear high-level overview as well as detailed data harmonization between all platforms . Three ways to see and debug the events ================================= 🟩 Clicking the extension icon 🟩 Using DevTools 🟩 On-screen toast messages TagHound Analytics debugger & Ad platforms pixel helper features ====================================================== 🟥 Read all supported pixels at once 🟥 Clear view of each pixel parameters, grouped into categories with over 1200 validation rules 🟥 Filter pixels by type 🟥 Record activity across page and export the results 🟥 Group tags by type/ad platforms 🟥 Sort tags by execution time, platforms, etc. 🟥 Exclude domains from being tracked by the extension to optimize performance Google Tag Manager features ======================== 🟨 dataLayer viewer 🟨 You can change the dataLayer name (the default dataLayer will always be tracked) 🟨 In the "Options" screen (the gear icon) you can add enhancements to Google Tag Manager Assistant (see pictures above): 🟪 Sort tags alphabetically 🟪 Highlight tags fired multiple times 🟪 Highlight tags with errors 🟪 Hide paused tags Release notes ============ 1.3.4 - Temporary removal of custom endpoints 1.3.2,1.3.3 - Minor bug fix 1.3.1 - Updating GA4 debugger, minor UI changes 1.3.0 - Supporting S2S custom endpoints 1.2.6 - Fixing Google Tag Assistant enhancements 1.2.5 - Update to GA4 debugger (new EU endpoints), design adjustments 1.2.2 - Update to GA4 debugger (privacy sandbox fine-tuning) 1.2.1 - Added Sleep-mode 1.2.0 - Adding on-screen debugging with toasts messages! Some refactoring for performance. 1.1.4 (1/4/2024) - Name change, performance optimization 1.1.3 - Adding Floodlight. Updating Facebook Ads pixel, improving performance and filters. 1.1.2 - Removal of self-hosted pixels tracking 1.1.1 - Bringing back GTM toggle to save browser memory. 1.1.0 - Improving GTM dataLayer parsing. 1.0.9 - Adding Google consent for Google-based tags 1.0.8 - Adding GTM toggle for less impact on browser memory. Turns OFF after 2 minutes of idle and redesign Settings page 1.0.7 - Updating Microsoft UET & LinkedIn ads tracking. Removing Google Optimize. 1.0.6 - Ability to change GTM dataLayer name, adding enhancements to GTM Tag Assistant 1.0.5 - Improving GA4 debugging 1.0.3 - Improving Facebook Pixel debugging 1.0.2 - Improving TikTok, LinkedIn & Taboola pixel tracking 1.0.1 - Removing redundant code and typo fix 0.9.3 - Google Ads conversion tracking improvement 0.9.1 - Google Analytics 4 debugger upgrade + code optimization 0.9.0 - Performance version. Decreasing the extension weight by 70%. 0.8.8 - Now supports Amplitude + improving Google Tag Manager performance. 0.8.7 - Adding Plausible Analytics, Umami Analytics & AB Tasty 0.8.6 - Fixing display bug for some users 0.8.5 - Improving GTM dataLayer viewer 0.8.4 - Improving Google Tag Manager events parsing 0.8.3 - Improving LinkedIn pixel tracking and Google Analytics 4 ecommerce validations 0.8.2 - Supporting the new TikTok custom events 0.8.1 - Upgrade Google Analytics debugging 0.8.0 - Update Google Analytics 4 CDN 0.7.9 - Updating Facebook pixel 0.7.8 - Upgrade Google Analytics debugging 0.7.7 - Removed cookie module 0.7.5 - Fixed: Some websites bloat GTM dataLayer with faulty values which caused the extension to break 0.7.4 - Adjusting TikTok standard events 0.7.3 - Major performance improvement, adding GTM JSON viewer 0.7.1 - Adding more events to Google Tag Manager dataLayer tracking 0.7.0 - Adding Google Tag Manager tracking 0.6.9 - Bing Ads changed to Microsoft Ads + minor bug fixes 0.6.8 - Adding MixPanel 0.6.5 - Adjusting to Facebook new pixel 0.6.1 - Faster recording 0.6.0 - Supports Snap Ads pixel, TikTok & Reddit pixel upgrade 0.5.9 - Adding Errors view in extension popup 0.5.2 - Fixing LinkedIn account ID identification 0.5.2 - Update TikTok pixel 0.5.0 - Adding Google Ads Conversion tracking 0.4.4 - Adding Google Ads Remarketing tracking and Bing Ads 0.4.2 - Adding AppsFlyer & TikTok tracking, update Twitter pixel 0.4.1 - Adding Pinterest pixel 0.4.0 - Adding Facebook & Quora & Google Optimize pixel tracking, Adding the ability to record activity 0.3.9 - Adding Taboola, Outbrain, LinkedIn and Google Analytics tracking 0.3.5 - Adding Twitter & Reddit pixel tracking 0.0.1 - Initial version

Instant Tracking Monitor for Google Analytics
Show Analytics hits & tracking errors in the extension Icon hits. This extension does mainly three things for you: A: it provides an instant overview of the current Google Analytics tracking fired on a page. See the number of properties, number of pageview hits and number of other hits displayed in the extensions icon-badge. B: it notifies you about 6 (possible) tracking errors e.g. Anonymize IP, duplicate Pageviews & Hitlength almost extended. You can turn off every error you want. C: Add your own tracking services you want to monitor, Ads Conversion Hits etc. 0.7: Update to Manifest V3 - had to remove blocking mechanic with this update 0.6 : Lots of new features: GA4 Support, Serverside GA Monitoring, Add and monitor your own custom Tracking services. 0.5 : new name & images after violation of branding guidelines / includes now most app+web hits / see the number of ga hits in the popup graphic/ bug fixes 0.4 : Bug Fixing for new App+Web-Tracking / improved Error handling for "no Hit after analytics JS"/ Bug Fixing of ni-parameter (can be true&false now instead of only 1&0) // new clicks brand

Analytics Debugger
Your Single Source of Truth (SSOT) for debugging analytics implementations Formerly known as "GTM/GA Debugger," our tool is your ultimate Single Source of Truth (SSOT) for debugging analytics implementations! Are you a developer, analyst, or marketer committed to achieving top-tier web analytics and tracking results? Look no further! Our powerful debug tool is meticulously crafted to simplify your life. Analytics Debugger streamlines your daily debugging tasks, boasting user-friendliness for all while delivering in-depth insights to advanced users. v2.4.6 - Adds support for Chartbeat - Fixed Amplitude Regional Collection Endpoints 🛠️ Wide Compatibility: Our tool seamlessly supports a variety of analytics and tracking tools, including: - Google Tag Manager - Google Analytics - Tealium - Piwik Pro / Matomo - Adobe tools - and most commonly used Marketing Pixels. to mention some of them (Check the full list here) 🔒 Privacy Enhancement: Rest assured, our tool injects code only after DevTools has loaded, with no background monitoring. 🚀 Tools: Supercharge your tracking implementation with a rich toolkit including - GTM Preview Enhancer: USe this tool to bypass all the limitations from the original Preview Mode - Google Analytics Debug Libraries Loader - Block GA3/GA4 Hits: Prevent your - Export Features - Real-Time Data - Enhanced Ecommerce Reports - Data Filtering for Focused Insights - Clicks Blocker: Prevent being redirected to next page - and much more! Get started today and elevate your analytics debugging and optimization process effortlessly. Unlock the full potential of your analytics and tracking endeavors – streamline your workflow, enhance privacy, and gain profound insights seamlessly. Download now and experience the transformation! Changelog: You can check out our latest updates on our GitHub repository. https://github.com/analytics-debugger/analytics-debugger-browser-extension Support / Feedback: Offered via the Store or using the Github Repository Official Documentation: For detailed guidance, visit our official documentation at https://www.analytics-debugger.com/tools/browser-extension Don't miss out on this game-changing tool. Elevate your analytics game today!

DataLayer Checker Plus
The simplest way to debug and verify dataLayer implementations without using the browser console Growth Academy is excited to announce the release of DataLayer Checker Plus , featuring several features . NEW FEATURES: - Inspect DataLayer on any website - Auto colouring for different data types - Inspect dataLayer in a Shopify Store if dataLayer is enabled through customer events or theme. - UI Improvements - Connect GTM in any website - Bug Fix All messages pushed to the dataLayer will be listed in the extension tab, whether they occur on page load, through events, or are manually pushed. Simply install the extension, visit any website, and click on the extension icon to display the dataLayer content. The basic setup is compatible with the default dataLayer in Google Tag Manager. This extension also assists you in inspecting the dataLayer enabled through Customer Events on a Shopify store. To enable this feature, navigate to the settings page of the extension and activate the “Shopify Custom Pixel DataLayer Checker”. If you have not enabled the dataLayer through Customer Events, there is no need to make any changes—the default settings will function correctly. You found a bug ? Please contact us on contact@growthacademy.io Thank you for your help and your support!