
aphoemnhgnocfcelkiiggcjpmklbeloo
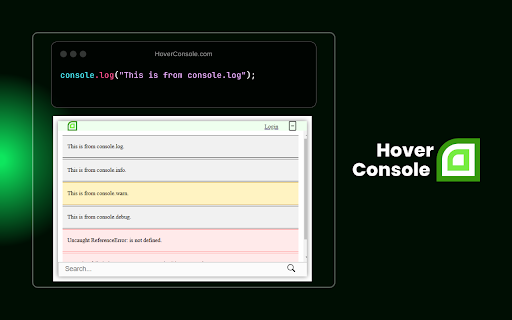


Step up your JavaScript debugging in-browser with Hover Console Extension. Streamline errors and fix bugs instantly - Try it now! Struggling with JavaScript debugging and console errors in the browser? Tired of losing your valuable data in the tiny console window when you refresh the website? But don’t worry, Hover Console is here to simplify your coding life. This advanced JavaScript debugger empowers developers to analyze code effectively. Get started today and experience the difference for yourself. Your code deserves the best debugging companion, and Hover Console Extension is just a click away! 🟢 Supercharged JS Debugger: ↳ Say goodbye to deciphering complex console logs. Hover Console supports all data types, including text, numbers, arrays, and JSON objects, making debugging more intuitive and efficient. 🟢 AI-Powered Error Resolution: ↳ Hover Console leverages AI to analyze your code and automatically suggest solutions for errors. It doesn’t just identify the problem but provides intelligent, context-aware recommendations, helping you fix bugs faster and with greater confidence. 🟢 Tabular Data Display: ↳ Visualize your data in a structured, easy-to-read format with console.table(). No more scrolling through endless logs—your data is organized and presented clearly in table form. 🟢 Panel Position Control: ↳ Tailor your experience by moving the panel where you want it - side, bottom, or your choice! 🟢 Domain-Specific Panel Toggle: ↳ Sick of cluttered panels? Hide or show it for a specific domain. Your preferences stick, keeping debugging clean and hassle-free, without affecting other websites. 🟩 What’s New: ↳ Enhanced JS debugger integration for easier error tracking and data visualization. ↳ More precise AI-driven suggestions tailored to common JavaScript debugging challenges. ↳ Improved performance for real-time debugging in complex JavaScript environments. 🟩 What's Coming Next: ↳ Our commitment to enhancing your JavaScript debugging experience in the browser doesn't stop here. More powerful JS debugger features are on the way to make Hover Console even more indispensable for JavaScript developers. Install "Hover Console" and elevate your JavaScript debugging to a whole new level. Say hello to a more efficient, organized, and enjoyable coding journey with Hover Console by your side. Get started with the ultimate JavaScript debugger today and experience the difference! 🟩 Should you encounter any issues or have valuable suggestions: 🌎 Join our community: https://fb.com/groups/813948899701642/ ✉️ Email us: info@hoverconsole.com 💬 Chat with us: hoverconsole.com

Woody - Console free logging
A chrome extension to view logs outside of the console. View console logs without opening the console

Console Importer
Import JavaScript and CSS resources from console, with one command A tool for developers to easily import JS and CSS resources from Chrome console

JavaScript Tools
JavaScript Tools This extension is developed by the AEDEV Development Team This extension allows you to run scripts on any website quickly and easily with a nice and easy-to-understand menu with options to only show your favorite ones! Please note that more JavaScript Bookmarklets will be added in future versions of this extension. We currently support the following JavaScript Functions: - Editing any text on any webpage - Generating unique passwords - Word/Character Counter (On selected text inside a webpage or manually) - Is this down for me or everyone? - Enable Right Click on websites that disallow it - Show password fields in plain text - Viewing website history using Wayback Machine - Viewing website scripts - Remove all images on the site We hope you will like our extension! AEDEV Development Team For support, please contact: support@aedev.ca

Pointer - Element Inspector for DevTools
Enhanced element inspection with cursor-driven workflow. Visual highlighting, measurements, and DevTools integration. Pointer enhances Chrome's built-in element inspector with a persistent, intuitive DOM navigation tool that stays active while you work. Unlike the default DevTools inspector that turns off after selecting an element, Pointer keeps running so you can quickly inspect multiple elements without constantly reactivating the tool. — Always-On Element Selection - Navigate the DOM using arrow keys or click to select elements. The pointer stays active between selections. — Visual Box Model Display - See margin, padding, and content areas with color-coded overlays. — Element Information - Hover over any element to see its tag name, dimensions, CSS classes, and behavioral badges (flex, grid, media, scroll containers and event listeners). — Built-In Ruler - Hold Alt to see pixel distances between selected and hovered elements. — DevTools Integration - Selected elements automatically sync with Chrome DevTools Elements panel. The inspector scrolls elements into view and maintains selection state when DevTools is reopened. — Pass-Through Mode - Hold "`" (backtick) to temporarily interact with page elements normally while keeping the inspector active. — DOM Manipulation - Cut, copy, paste, delete, and duplicate (Cmd/Ctrl+D) elements directly in the page. Full undo/redo support. — Inline Attribute Editor - Press "/" to add attributes, classes, and properties to selected elements without switching to the DevTools elements panel. — JavaScript Console - Press ";" to execute JavaScript commands with the selected element as "this" context. Perfect for quick DOM modifications and debugging. — Selector Search - Press "f" to enter find mode and highlight all elements matching a CSS selector in real-time. Navigation — Arrow Keys - Navigate between elements (up/down for siblings, left for parent, right for children). Inspection Tools — Alt - Show measurement rulers between selected and hovered elements — ` (backtick) - Hold to enable pass-through mode so you can interact with the web page