
phciecnkpadblcnckpiefjmfdnkndepi
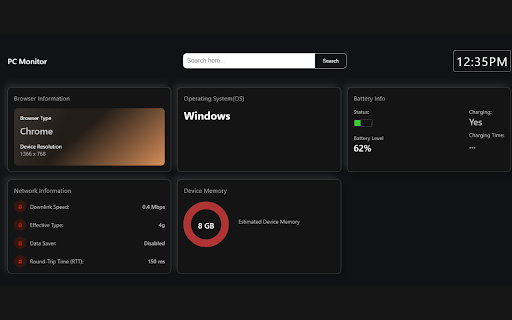
A chrome extension for monitoring PC Stats, including network information. Keep your computer's key metrics at a glance with the PC Monitor Chrome extension! Designed for efficiency and ease of use, this sleek dashboard provides real-time updates on your system's performance, including browser type, device resolution, network speed and type, battery status, and estimated device memory. Whether you're a power user needing to monitor your system's resources or someone who likes to stay informed about your PC's health, PC Monitor gives you the essential information without clutter or complication. Simply install the extension and enjoy a comprehensive overview of your PC's performance directly in your Chrome browser. With PC Monitor, staying on top of your system's status has never been easier!

Network Monitor
Use Network Monitor for real-time connection tests, internet quality tests, and detailed network performance insights. ✨ Introducing our user-friendly Google Chrome extension designed to help you effortlessly monitor your network. Whether you're working from home, gaming, streaming, or just browsing the web, our extension offers powerful monitoring capabilities to ensure you always have a fast and reliable internet connection. 👍 Simple Network Monitor Our extension is a straightforward tool that gives you real-time insights into your network's performance. Easily track your connection health and spot any issues that could slow you down. 🛠️ Easy-to-Use Monitoring Tools Our network monitoring tools are designed for everyone. No technical expertise is needed. These tools deliver clear data and insights, helping you understand and manage your network with ease. Key features include: • Real-time performance checks • Easy-to-read metrics • Clear and concise reports 🛡️ No Traffic Monitoring Needed 🔹 Performance and connectivity without monitoring your traffic 🔹 Enhanced privacy 🔹 Focus on essential performance metrics 🔹 Reduced data usage ⏱️ Real-Time Monitoring Stay on top of your work with real-time monitoring. Be instantly alerted to any problems or disruptions, allowing you to fix them quickly and keep your internet running smoothly. Get instant notifications, real-time data updates and historical data views. 🤗 User-Friendly Network Monitoring Software Our network monitoring software is perfect for casual users. It's simple to install and use, offering all the features you need to keep your internet running smoothly. Features include: - Easy installation - Clear and intuitive interface - Helpful tips and support 🏎️ Network Performance Monitoring Experience excellent network performance monitoring with our extension. Track performance metrics, spot issues early, and ensure your network always runs at its best. Major advantages are: 📌 Clear visibility 📌 Early issue detection 📌 Detailed performance insights 📌 User-friendly interface 🧰 Reliable Network Performance Monitor Ensure your internet always runs optimally with our reliable network performance monitor. This tool helps you maintain high performance and quickly address any issues. Key benefits include, continuous measurement, early issue detection, clear performance metrics and easy-to-use interface. 🌐 Internet connection test Perform an internet connection test to ensure your connectivity. Our tool provides accurate and easy-to-understand results, helping you quickly identify and resolve connection issues. Key features are: 💡 Accurate connection speed test 💡 Simple connectivity checks 💡 Clear, detailed reports 💡 Easy-to-use interface 🚄 Connection Speed Test Use our connection speed test to measure your network speed. This feature provides real-time data on your connection speed, helping you ensure your internet is running efficiently. Benefits include: 1️⃣ Quick and easy results 2️⃣ Real-time speed data 3️⃣ Performance insights ✨ All-in-One Network Tools Our extension includes a comprehensive set of network tools designed to help you measure and manage your connection effectively. From performance measurement to speed analysis, we've got you covered. Tools include: 🔸 Performance analyzers 🔸 Connectivity testers 🔸 Speed testers 🛜 Comprehensive Connection Test Our connection test feature allows you to thoroughly test your connectivity. Identify any weak points and ensure a stable and reliable internet connection. Features include: full connectivity testing, performance metrics and simple resolution tips. ❓ FAQ Q: How do I install the extension? A: Simply go to the Chrome Web Store, search for our network monitor extension, and click "Add to Chrome". Q: Do I need technical knowledge to use this extension? A: No technical expertise is needed. Our extension is designed to be user-friendly and easy to navigate. Q: How can I test my internet speed? A: Use the built-in connection speed test feature to measure your network's speed in real-time. Q: Does this extension monitor my network traffic? A: No, our extension focuses on performance and connectivity without monitoring your network traffic, ensuring your privacy and reducing unnecessary data collection. 🚀 Experience excellent network monitoring with our Google Chrome extension. From real-time measurement to comprehensive performance analysis, our tool is designed to meet all your network management needs. Download now and take the first step towards a more reliable and efficient network.

Network Request Analyzer
Analyzes the timing of all network requests on the current page 🚀 Network Request Analyzer – Gain Full Visibility into Web Requests! Network Request Analyzer is a powerful Chrome extension designed for developers, performance engineers, and data analysts. It provides real-time insights into all network requests on the current webpage, helping you optimize loading speed, troubleshoot performance bottlenecks, and improve overall web efficiency. 🔍 Key Features: ✅ Comprehensive Network Request Analysis – Capture and analyze all HTTP/HTTPS requests, including DNS lookup, TCP connection, TLS handshake, request wait time, and response time. ✅ AI-Powered Performance Insights – Get intelligent recommendations and optimization suggestions using advanced AI analysis of your network requests. ✅ Visualized Timing Breakdown – A clear timeline view helps you understand request concurrency, blocking points, and load sequences. ✅ Performance Bottleneck Detection – Identify slow requests and optimize resource loading order for a faster browsing experience. ✅ Multiple AI Providers Support – Configure your preferred AI model (OpenAI, Anthropic, Deepseek) for detailed performance analysis. ✅ Downloadable Reports – Generate and download comprehensive performance reports to share with your team. ✅ A Must-Have for Web Performance Optimization – Ideal for tuning CDN, lazy loading, prefetching, and other front-end performance strategies. ✅ Real-Time Monitoring Without DevTools – Get instant insights into network activity without opening Chrome Developer Tools, making analysis more efficient. 🎯 Why Install It? For Frontend/Backend Developers – Optimize API response times, debug latency issues, and enhance rendering performance with AI-suggested improvements. For SREs & DevOps Engineers – Analyze network performance, detect slow queries, and eliminate network bottlenecks using intelligent pattern recognition. For Data Analysts – Understand the loading sequence of different resources and refine data transmission strategies with AI-driven recommendations. For General Users – Monitor page load speeds and identify slow resources that affect browsing experience. 📥 Install Now & Take Control of Your Web Performance! With Network Request Analyzer, you can effortlessly inspect all network requests with detailed timing data and get AI-powered optimization insights—making web performance tuning easier and more intuitive!

Hardware Info & Monitor Utility for ChromeOS
Simple & Powerful Hardware Information Utility for ChromeOS. crOS HI&MU allows you to monitor your hardware's current usage statistics & list your hardware's exact information without requiring you to leave your browser. You can support this project by buying a coffee: buymeacoffee.com/gokacinlar -v1.0.6: -Fix: Options page not working on some devices -Add: Better top header UI -v1.0.5: -New: Options page for better user control over the extension: Users can now select whether app should display hardware monitoring or information or both. -Fix: Some broken UI elements. -Add: Some UI enhancements (icons, font weight & size and background changes) v1.0.4: -New: Extension now supports displaying Network Information v1.0.3: - New: Extension now supports displaying GPU Information - New: Added tabs to switch between hardware monitoring & information for UI clarity. v1.0.2: - New: Extension now supports displaying Monitor (Display) Information - Fix: Various fixes

CPU and Memory Performance Monitor
Features:- 1. Monitor CPU Usage 2. Monitor Memory Usage. 3. Monitor CPU Temperature (in Fahrenheit) (Visible on Chrome OS only/ Graph Only) 4. Chrome Window/Tab Counter 5. Network Status Indicator 6. Clean Memory/CPU: - Discarding inactive tabs can release memory used in loading web pages in background. If you have multiple tabs open, this can save anywhere between 0%-40% memory. 7. Clear browsing data (with options to set time range and clean up preferences.) 7. Shortcut to Reset Chrome. 9. Works in online/offline mode. This tool provides an option to monitor CPU, CPU Temp and Memory utilization as number or in graph mode. (You can enable/disable specific legend in graph by clicking on legend label.) Permissions: - CPU & Memory read permission, Clear Browsing Data (Delete only), local storage (to save browser clean up options) . ** This tool does not interact with applications open in your chrome window. This tool does not transfer any data to or from your system. Version History: - 9/17/24-V1.7/V1.8 (Fixed Icon issue) 9/13/24-V1.6 Updated manifest version V3 12/28/20 - V1.2 # Added Options page (right click on toolbar icon) to set options for browser data clean up. # Removed Shortcut to Clear Cache and added direct functionality to clean browsing data based on options set up by user. # Removed Current Tab Count parameter and added Network Status. 12/13/20 - V1.1 # Added CPU Temperature in Graph mode (Chrome OS only) # Added Tooltip on toolbar Icon to display CPU and Memory Usage. # Added Status/Confirmation Message on "Release Memory" button to display number of tabs discarded and memory saving estimate. 12/06/20 - V1.0 # Monitor CPU/Memory graph, Capture Window/Tab count and Chrome Version, Shortcut to clear cache & reset chrome, Option to discard background tabs to release memory.