
ndkonkooaokgngjhjjefnnkdbmhgekkf


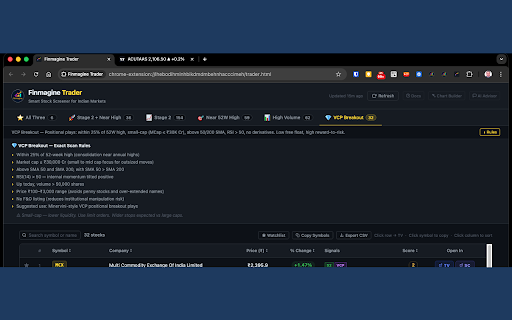

Scan NSE stocks for Stage 2 uptrends, VCP breakouts, 52-week highs & volume surges. One-click momentum screener for Indian markets. Finmagine Trader — NSE Momentum Scanner ======================================== Scan every NSE-listed stock in seconds. Finmagine Trader runs institutional-grade momentum screeners simultaneously and surfaces the strongest setups — so you spend your time analysing, not scanning. Whether you are an active swing trader or a long-term investor, Finmagine Trader tells you which stocks are in confirmed uptrends, getting institutional attention, and pressing new highs — right now. Use it to find new ideas, validate stocks on your watchlist, or simply stay on the right side of the market. Full documentation, guide, and tutorials: https://finmagine.com/finmagine-trader.php ── WHAT IT DOES ────────────────────────────────────────── One click. Live data. Eleven focused tabs: ⭐ All Three — Stage 2 + Near 52W High + High Volume. All three signals firing at once. Highest conviction momentum setups. 🚀 Stage 2 + Near High — Minervini Stage 2 uptrend with no overhead resistance. Pre-breakout watchlist. 📈 Stage 2 — Full Stage 2 universe. All moving averages in order and rising. The complete momentum field. 🎯 Near 52W High — Within 2% of annual high. Breakout candidates across all market caps. 📊 High Volume — Volume surging above 20-day average on an up day above SMA 50. Fresh institutional interest signal. 💎 VCP Breakout — Volatility Contraction Pattern. Small-to-mid cap, above 50/200 SMA, RSI > 50, no derivatives. Minervini-style positional plays. 📐 3-Week Tight — Three consecutive weekly closes within 1.5% of each other, SMA 50 above SMA 200. Tight consolidation before the next breakout. 🏷️ BRS — Breakout Readiness Score for every Stage 2 stock. Composite 0–100 score across five signals: Trend Template · Relative Strength vs Nifty · Proximity to high · Stage · Breakout Quality. Five tiers: 🔥 Elite Breakout (95+) · 🥇 Breakout Ready (85–94) · 🟢 Setup Forming (70–84) · 🟡 Early Stage (55–69) · ⬜ Avoid ( ₹25, MCap ≥ ₹300 Cr, 50-day average turnover ≥ ₹5 Cr. Review each chart for a U-base forming below the first-day high — enter when price closes above it. 🔊 Volume — Stocks hitting Highest Volume Quarter (HVQ), Year (HVY), Decade (HVD), or Ever (HVE) today on an up day. Institutional accumulation signal. HVE = strongest conviction; HVD = decade high; HVY = very strong; HVQ = notable. 🐂 Bull Snort filter: volume ≥ 3× 50-day average AND close in the top 25% of the day's range — strong closes with conviction. Stage · RS · BRS shown on every row. ── KEY FEATURES ────────────────────────────────────────── • BRS score — Breakout Readiness Score (0–100) ranks every Stage 2 stock by setup quality across 5 signals • Stage badge — every stock shows Stage 1 / 2 / 3 / 4 classification based on full Minervini moving average hierarchy • Relative Strength — RS score (0–100) vs Nifty 50 over 12 months; outperformers rank highest • Trend Template — TT ✓ badge confirms Minervini's 8-point institutional-grade momentum filter • BRS ribbon — Screener.in signals bar now shows BRS score, Stage, and TT status inline • PM Watchlist button — "★ PM" on every row adds the stock to Portfolio Manager Watchlist in one click • AI Advisor integration — signals bar in Finmagine AI Advisor shows live Trader scan results for every Screener.in stock • Background auto-refresh — scans update every 6 hours automatically, even with popup closed • 3-Week Tight tab — dedicated scan for weekly consolidation setups • Turnover column — ₹ Cr daily turnover (volume × close), sortable, CSV exported • Near-pivot watchlist alerts — toast notification when watchlisted stocks enter Near 52W High scan • Tight Volatility filter — show only stocks with contracting ATR: ATR(14) below ATR(50) • Sector grouping bar — see which industries dominate each scan; click to filter by sector • Live market data — updated on every refresh • 15-minute smart cache — instant reopens, always current • Index filter — restrict scans to Nifty 50 / 100 / 200 / 500 universe • Market cap filter — filter from ₹500 Cr to ₹50,000 Cr in one click • Score filter — show only Score ≥ 1 / ≥ 2 / ≥ 3 / = 4 setups • Signals column — see which scans each stock passes (S2 / NH / HV / VCP) • Score pill — count of signals (1–4). Higher = stronger conviction • Watchlist — star stocks, toggle to watchlist-only view • Search — filter by symbol or company name instantly • Copy Symbols — one click copies all symbols for TradingView watchlist import • Export CSV — download full results for offline analysis • Open In — click any row to open TradingView chart; SC for Screener.in; SS for StockScans • Column sort — click any column header to sort • ETF excluded — index ETFs automatically filtered out ── WHO IS IT FOR ────────────────────────────────────────── 🔁 Active traders — find high-conviction swing and positional setups every morning in under 5 minutes. 📈 Long-term investors — discover quality stocks in confirmed uptrends with institutional backing. Check whether a stock you already own is still in Stage 2. Identify new ideas by seeing what the market is rewarding right now. 📊 Market observers — get a daily pulse on which sectors and stocks are showing strength, without needing to be a technical expert. ── HOW TO USE ────────────────────────────────────────── 1. Click the Finmagine Trader icon in your Chrome toolbar 2. Data loads automatically — results appear within a few seconds 3. Start with ⭐ All Three for the day's highest-conviction setups 4. Narrow to an index (e.g. Nifty 500) to focus on quality names only 5. Use Score ≥ 3 to surface the strongest multi-signal setups 6. Enable Tight Volatility to see only stocks coiling before a potential breakout 7. Sort by Turnover to focus on the most liquid setups 8. Use 📐 3-Week Tight for stocks in tight consolidation before a breakout 9. Use 💎 VCP Breakout for positional trade candidates 10. Use 🌟 IPO Breakout to catch new listings pressing all-time highs 11. Click any row to open the TradingView chart 12. Star stocks to build your watchlist; Copy Symbols to import into TradingView Full guide with scan logic, strategy explanations, and examples: https://finmagine.com/finmagine-trader.php ── SCAN METHODOLOGY ────────────────────────────────────────── All scans are based on publicly documented momentum and trend-following frameworks: Stage 2 — Mark Minervini's Stage Analysis (price above rising 50/150/200 SMA in correct order, near 52-week high range, liquid) Near 52W High — Within 2% of annual high, price ≥ ₹20, MCap > ₹500 Cr High Volume — Volume > 20-day average, price up >1% today, above SMA 50, non-F&O VCP — Volatility Contraction Pattern per Minervini: small/mid-cap, above 50/200 SMA, RSI > 50, no derivatives, up today 3-Week Tight — Three consecutive weekly closes within 1.5% of each other, SMA 50 above SMA 200 IPO Breakout — Listed within last 365 calendar days + Price > ₹25 + MCap ≥ ₹300 Cr + 50-day avg turnover ≥ ₹5 Cr Tight Volatility — ATR(14) below ATR(50): short-term volatility contracting relative to recent history BRS — Breakout Readiness Score: TT (25 pts) + RS vs Nifty (25 pts) + Proximity to 52W high (20 pts) + Stage (20 pts) + Breakout Quality (10 pts) = 100 ── WHAT'S NEW IN v2.5.0 ────────────────────────────────────────── 🌟 IPO Breakout tab fixed — The tab was always returning zero results due to two bugs in the underlying scan logic. First, the IPO detection condition used an undefined SMA comparison that ChartInk treated as null, causing every stock to fail the filter silently. Second, the breakout condition required the stock to be within 2% below its 52-week high — but IPO stocks in their base phase typically sit 20–40% below the listing-day spike, so the threshold never fired. The scan now correctly identifies stocks listed in the last 365 calendar days (detected by absence of price data 365 days ago) that meet the liquidity bar: Price > ₹25, MCap ≥ ₹300 Cr, 50-day average turnover ≥ ₹5 Cr. 📜 Tab bar scrolling — With more tabs than fit the screen, the tab bar now scrolls horizontally. A visible scrollbar appears at the bottom of the tab row, and clicking any tab automatically scrolls it into view. ── WHAT'S NEW IN v2.4.2 ────────────────────────────────────────── 🔢 Volume tab count badge fix — The count badge on the Volume tab was showing (0) even when the tab was fully populated. Volume data loads in a second background pass after the main scan; the badge now updates correctly once that pass completes. 🐂 Bull Snort fix — The closing-strength check ((close − low) / (high − low) ≥ 0.75) is now enforced directly inside the ChartInk scan query, where intraday OHLC data is available. Previously the check ran client-side against fields not returned by the ChartInk API, causing all volume ≥ 3× average stocks to pass regardless of closing position. Stocks like Sobha and Tata Tech that did not close in the top 25% of their day's range will no longer appear. ── WHAT'S NEW IN v2.4.1 ────────────────────────────────────────── (Superseded by v2.4.2 — changes included above.) ── WHAT'S NEW IN v2.4.0 ────────────────────────────────────────── 🐂 Bull Snort filter — A new sub-filter chip on the Volume tab surfaces the strongest closes: volume ≥ 3× the 50-day average AND the stock closes in the top 25% of the day's high-low range. These are stocks closing strong with real conviction behind the move — not just a volume spike that fades. Suggested by @karanshah137 on ValuePickr. 📅 HVD — Highest Volume Decade — A new fourth volume tier looking back 10 years (2,520 trading days). Sits between HVY and HVE in the hierarchy. Stocks hitting HVD on an up day have not seen this level of buying in a decade. Badge colour: purple. 📈 HVE extended — Highest Volume Ever lookback extended from ≈8 years (2,000 days) to ≈15 years (3,750 days). HVE signals are now compared against the longest available history for each stock, making them significantly more meaningful. 📊 Stage · RS · BRS on Volume tab — Every Volume tab result now shows the Weinstein Stage badge (S1/S2/S3/S4), Relative Strength vs Nifty arrows (3M/6M/12M), Breakout Readiness Score (0–100), and BRS Tag. The killer combo: HVE or HVD + Stage 2 + BRS ≥ 70 = institutional event in a confirmed uptrend — now visible in a single row. 🏷 Sub-filter chips updated — All | HVE | HVD | HVY | HVQ | 🐂 Bull Snort, with live counts per tier. ── WHAT'S NEW IN v2.3.0 ────────────────────────────────────────── 🔊 Volume Tab — New dedicated tab for institutional volume signals. Three tiers: HVQ (Highest Volume Quarter — 63-day max), HVY (Highest Volume Year — 252-day max), HVE (Highest Volume Ever — ≈8 years). Mirrors the @finallynitin "Simple Volume with Pocket Pivots" scanner on ChartInk. BUY-direction only — only up days qualify. Liquidity-filtered: (50-day avg vol × price) > ₹50L. Price ≥ ₹20, MCap ≥ ₹100 Cr. 🏷 HVE / HVY / HVQ badges — gold / green / blue colour-coded badges on every row. HVE > HVY > HVQ hierarchy: if a stock qualifies for multiple tiers, only the strongest is shown. 🔎 Sub-filter chips — All | HVE | HVY | HVQ chips in the filter bar let you isolate a signal type in one click. Counts shown per tier. ⚡ Two-stage loading — Volume scans are heavy ChartInk queries. All existing tabs load instantly; volume data loads asynchronously in the background with a loading indicator. ── WHAT'S NEW IN v2.2.0 ────────────────────────────────────────── 🪤 Bottom Tab — broader scan: ADR% filter removed. The scan now surfaces all stocks >50% off their 52-week high with proven historical momentum — without the ADR% constraint that was artificially limiting results. Use BRS to rank what you see; the scan's job is to find the candidates, BRS's job is to separate them. 📐 Bottom momentum logic updated — the "any one momentum signal" filter now matches the original scanner exactly: 3+ days >15% gain in last 720 days, OR 4+ days >10% in last year, OR 2+ days >10% in last 60 days, OR 2+ days >7% in last 20 days, OR NR7 consolidation today or yesterday. More stocks surface; BRS does the filtering. ── WHAT'S NEW IN v2.1.0 ────────────────────────────────────────── 🪤 Bottom Tab — A new dedicated scan surfaces stocks more than 50% off their 52-week high that have a proven history of explosive momentum and are now forming a tight NR7 consolidation (narrowest daily range in 7 days). These are deeply beaten-down names coiling for a potential reversal — not random dip picks. BRS score shown for every result — use it to separate genuine recovery candidates from value traps. 📊 BRS on Bottom Tab — Every Bottom result shows its Breakout Readiness Score prominently. Favour stocks with BRS ≥ 40 for higher-conviction setups. Stocks with BRS

Finmagine Portfolio Manager
Multi-broker portfolio tracker with per-broker stop-loss, XIRR, Decision Journal, and multi-asset tracking for Indian investors Stop managing your portfolio in a spreadsheet. Finmagine Portfolio Manager tracks every lot, every broker, and every asset class in one place — with per-broker stop-loss discipline built in from the start. 📌 Full feature guide & tutorials: https://finmagine.com/portfolio-manager.php 🏦 MULTI-BROKER, MULTI-ASSET TRACKING Most portfolio apps show you a blended average. If you hold TITAN across Zerodha, Upstox, and Groww, you see one merged number — useless for stop-loss decisions. Finmagine PM tracks every lot independently, per broker, so you see exactly which position is in trouble. 4 asset classes in one extension: • 🇮🇳 Indian Equities — NSE/BSE stocks, per-broker columns, XIRR, PEG, N50/N500 index beat • 🌏 Global Equities — US-listed stocks, USD + ₹ INR columns, XIRR • 🏦 Mutual Funds — Indian MF schemes, NAV, Units, P&L%, XIRR, Index Beat • 🌐 Global Funds — US ETFs and mutual funds (VOO, FBGRX etc.), USD + ₹ columns 📊 8 TABS OF PORTFOLIO INTELLIGENCE • Holdings — full portfolio with per-broker P&L%, XIRR, PEG, 3Y/5Y CAGR, signals, N50/N500 • Alloted — every lot of this stock is ≥ +5% P&L (fully committed positions) • Consider — positions below ₹3,00,000 invested (undersized, worth evaluating) • Add More — any lot below +5% P&L (room to strengthen) • Watchlist — 25-column fundamental comparison: P/E, P/B, ROCE, ROE, D/E, OPM%, EPS growth, pledging, promoter holding, Finmagine Score, Trader Signals and more. Large/Mid/Small cap filter chips. • Charts — 13 chart types including the History ✦ chart showing your portfolio's true value month by month vs a Nifty 50 DCA benchmark • Alerts — stop-loss breach dashboard with Chrome push notifications • Journal — Decision Journal with Pattern Analysis 🧠 DECISION JOURNAL Every trade you save gets a "Why did you buy this?" thesis — auto-generated from signals and fundamentals, or entered manually with 7 category chips (Momentum, Quality, Dip, Target, Adding, Tip, Index). After 20+ trades, the Pattern Analysis table shows which types of decisions have actually worked for you: average P&L% and win rate per category. Honest feedback on your investment process, built from your own trades. ⚡ LIVE DATA — AUTO-REFRESHED • Live prices, day change, and monthly price history • PEG, 3Y/5Y Price CAGR, Profit CAGR, and 18 fundamental metrics — refreshed automatically • Momentum signals per stock: Stage 2, Near High, High Volume, VCP, IPO Breakout • Indian MF NAV — real-time updates 🔔 STOP-LOSS ALERTS Configure your stop-loss % in Settings. The extension badge shows breach count. Chrome push notifications fire when any position crosses your threshold — even when the extension tab is not open. 📈 XIRR & INDEX BEAT Every holding shows annualised XIRR. The N50 and N500 columns show what Nifty 50 / Nifty 500 returned since your purchase date — the only honest benchmark for whether you're actually beating the market. 🔄 CORPORATE ACTIONS Stock split or bonus? One click updates all your lots across all brokers simultaneously — quantity adjusted, cost per share adjusted, net cost recalculated. No manual row-by-row editing. ☁️ CLOUD SYNC Sync your portfolio to your Finmagine account. Access across devices. Pull trades from any browser with one click. 🔒 PRIVACY • All portfolio data stored locally in Chrome storage • Prices fetched directly from public APIs — no proxy, no server sees your holdings • Cloud sync is opt-in and tied to your Finmagine account 📊 PART OF THE FINMAGINE ECOSYSTEM • Chart Builder — visualize 12 years of financials with 6-tab deep analysis: https://finmagine.com/chart-builder.php • AI Advisor — generate institutional-grade AI analysis prompts from Screener.in: https://finmagine.com/ai-advisor.php • Trader — NSE momentum scanner (Stage 2, VCP, Near 52W High): https://finmagine.com/finmagine-trader.php Full ecosystem: https://finmagine.com/portfolio-manager.php --- 🆕 WHAT'S NEW v1.4.0 (March 2026) • Any broker accepted — CSV import and the Add Trade form now accept any broker name (SBICaps, Axis, IIFL, Motilal, Kotak, and more). Previously only 9 brokers were recognised; trades from other brokers were incorrectly rejected. The broker field is now a free-text combo with suggestions — type anything. v1.2.0 (March 2026) • Add to Watchlist from anywhere — "★ + Watch" button now appears in the Finmagine AI Advisor and Chart Builder panels on Screener.in and stockanalysis.com. "★ PM" button on every row in Finmagine Trader scan results. One click adds the stock directly to your PM Watchlist — no need to open PM separately. v1.1.0 (March 2026) • Decision Journal — every trade gets a "Why did you buy this?" thesis. Auto-generated from signals and fundamentals (VCP → momentum, high ROCE + low PEG → quality compounder, adding to position → auto-noted). 7 category chips for manual classification. Pattern Analysis at top of Journal tab shows avg P&L% and win rate per category — honest data on what decisions have actually worked. • Watchlist Journal — pre-buy research notes on watchlist stocks. 4 intent categories: Breakout watch, Waiting for dip, Researching, Near buy zone. When a watched stock is later bought, the original note is preserved alongside the trade thesis. • History ✦ chart — true portfolio value month by month from your first trade, built from Yahoo Finance monthly closes. Overlaid with a Nifty 50 DCA benchmark using the same cash deployed at the same dates. • Corporate Action modal — Stock Split and Bonus Share support. Enter ratio (e.g. 1:5 split or 1:1 bonus), review per-lot preview, apply to all lots across all brokers in one click. • Dark / Light theme toggle — ☀/☾ button in header. Applies to all tables, charts, modals, and drawers. Persisted across sessions. • Profit Growth CAGR columns — PG3Y% and PG5Y% (compounded profit growth) alongside existing price CAGR columns. PEG denominator toggle in Settings: switch between Price CAGR (default) and Profit Growth CAGR. • Watchlist mcap filter chips — All | 🏛 Large (≥₹20K Cr) | 🏢 Mid (₹5K–₹20K Cr) | 🏪 Small (

Finmagine Financial Chart Builder – Screener & Stock Analysis Tool
Charts for Screener.in, Google Finance, stockanalysis.com & Perplexity Finance. Health scores, DuPont Analysis & valuation verdicts. Visualise, compare, and analyse financial data directly on Screener.in, Google Finance, stockanalysis.com, and Perplexity Finance — without leaving the page. Full guide, tutorials, and documentation: https://finmagine.com/chart-builder.php • Instantly see growth acceleration or deceleration across any metric • Compare margins and ratios historically — in seconds, on the same page • Detect valuation compression or expansion without a spreadsheet • Identify risk via drawdown, volatility, and Z-Score overlays • Avoid exporting to Excel — the analysis happens where the data lives Designed for serious long-term investors and data-driven traders. One extension. Four financial platforms. Institutional-grade analysis. The Charts tab embeds a floating panel in the page — select any financial metric to plot it instantly. Mix Profit & Loss, Balance Sheet, Cash Flow, Ratios, and Shareholding data on a single chart. Line or bar, your choice. Quick Analysis — Instant health scores across Profitability, Solvency, Efficiency, Valuation, and Growth. Sector-aware benchmarks across 18 Indian sectors and 145+ GICS industries for US stocks. Calculated Ratios — Derived metrics that Screener doesn't show: DuPont decomposition, FCF Yield, ROCE, Incremental ROCE, EV/EBITDA, Capital Efficiency Score, and more. Price Analysis — CAGR across 1Y, 3Y, and 5Y periods. Indian Investor Returns in both INR and USD. Cyclical analysis, drawdown, RSI, Beta, and Altman Z-Score. Valuation — Intrinsic value models including Reverse DCF, Graham Number, PEG-adjusted fair value, and a Scenario DCF with three growth cases. Sourced directly from Screener's chart API. • Four display modes: Values | YoY % | QoQ % | % of Sales • Chronological growth columns with raw anchor baseline • Lines / Bars global toggle + per-metric chart type override • Acceleration (⚡ ACC) and deceleration (⚠ DEC) badges in QoQ % mode • Period filter: Last 3 / Last 5 / Last 7 / All reporting periods • CSV export of growth view tables (badge-free, spreadsheet-ready) • Interactive charts — select any metric, mix sections, export PNG • Five analytical tabs: Charts | Quick Analysis | Calculated Ratios | Price Analysis | Valuation • Incremental ROCE (3-year rolling) — return on newly deployed capital • Sector-aware analysis — 18 Indian sectors + 145+ GICS industries for US stocks • US stocks: Altman Z-Score, Piotroski F-Score, ROIC vs WACC, Analyst Outlook, Ownership • TradingView one-click — NSE, BSE-only, Google Finance, and US stocks • Draggable, resizable panel — Normal / Wide / Full-screen modes • Saved metric preferences — your selections persist across page visits • Auto-detects Google Finance tab changes (Annual / Quarterly / TTM) via MutationObserver • Supports Screener.in, Google Finance, stockanalysis.com, and Perplexity Finance • Screener.in — full feature set (all five tabs, all display modes) • stockanalysis.com — full feature set for both US stocks (/stocks/) and Indian stocks (/quote/nse/ and /quote/bse/) • Perplexity Finance — Charts, Quick Analysis, and Calculated Ratios • Google Finance — Charts tab with auto-refresh on tab changes 1. Open any company page on Screener.in, stockanalysis.com, Perplexity Finance, or Google Finance 2. Click "Visualise with Finmagine" or use Ctrl+Shift+F (Cmd+Shift+F on Mac) 3. Check any metric to add it to the chart; mix sections freely — use Lines / Bars to switch chart type globally, or override per metric via the legend badge 4. In the growth view, choose Display: Values / YoY % / QoQ % / % of Sales; use the Period Filter to focus on Last 3, 5, or 7 periods; export as CSV with the Export button 5. Switch tabs to access Quick Analysis, Calculated Ratios, Price Analysis, or Valuation 6. Click TradingView in the header to open the stock's chart in TradingView Full documentation and worked examples: https://finmagine.com/chart-builder.php 🏦 Improved support for BSE-listed companies — the extension now better identifies BSE codes from company pages, improving accuracy for BSE-listed stocks. 🇮🇳 Indian Stocks on stockanalysis.com — Chart Builder now activates on Indian stock pages at stockanalysis.com. Previously only US stocks (/stocks/AAPL/) were supported. Indian stocks use a different URL format (/quote/nse/RELIANCE/) which is now fully detected. All five tabs — Charts, Quick Analysis, Calculated Ratios, Price Analysis, and Valuation — work on Indian stocks exactly as they do on Screener.in. 🟣 + Watch Button — A "★ + Watch" button now appears in the Chart Builder panel header on every Screener.in company page. If Finmagine Portfolio Manager is also installed, one click adds the current stock directly to your PM Watchlist without leaving the page. Confirms "✓ Watching" on success, or "✓ In WL" if the stock is already in your watchlist. 📡 Operational KPIs for AI Advisor — Chart Builder now automatically enriches AI Advisor prompts with company-specific operational KPI data when you visit a company page. Store counts, conversion rates, per-unit revenue, patent counts, debtor days, and any other company-specific operational metrics are picked up automatically and appear in the Business KPIs Deep Dive template — no extra steps required. 🎯 Trader Signals Ribbon — If you use the Finmagine Trader extension alongside Chart Builder, a new persistent ribbon now appears between the panel header and the tab bar on Screener.in company pages. It shows coloured badge chips for every active momentum scan the stock appears in — Stage 2, Near 52W High, VCP Breakout, IPO Breakout, and more. The ⭐ "All Three" badge highlights the highest-conviction signal in gold. A stale cache shows a ⚠ timestamp so you always know the age of the data. If Trader is not installed, or the stock is not in any scan, the ribbon stays hidden — no clutter. This turns Chart Builder into a unified analysis + signal surface: fundamentals and momentum on the same page, at the same time. 👤 Profile Tab — A new 7th tab on Screener.in company pages. Pulls the company's About description (with citation noise stripped), and the Screener Pros and Cons lists into a clean two-column layout — so you can read the narrative and the quick verdict without scrolling away from your analysis. 🟣 Floating Visualize Button — A compact circular button now appears on the page while the panel is closed. Hover over it and it expands to show the full "Visualize with Finmagine" label. One click opens the panel instantly — no need to find the extension icon in the toolbar. 📐 Incremental ROCE — The question ROCE doesn't answer is: what return is the company earning on NEW capital it's deploying? This new card in the Calculated Ratios tab computes ΔOperating Profit / ΔCapital Employed over a 3-year rolling window. A business with 30% ROCE but 10% Incremental ROCE is a melting ice cube. A business with 20% ROCE and 35% Incremental ROCE is a compounder. The gap between the two tells you everything about where the business is going. 🎯 Smarter Sector Detection on Google Finance & Perplexity — Quick Analysis now correctly identifies the Indian sector before running scoring. Previously, stocks on Google Finance and Perplexity defaulted to a generic profile when no sector breadcrumb was available. Now TITAN gets Jewellery benchmarks, HDFCBANK gets Banking benchmarks, regardless of which platform you're on. • No login required — works instantly on any supported page • No personal data collected or transmitted • No trading access requested — read-only overlay • Does not modify website data — original tables always preserved • Lightweight — no background processes when the panel is closed Finmagine is an Indian stock market analysis platform providing professional-grade research tools, company reports, and financial education. Website: https://finmagine.com Extension guide: https://finmagine.com/chart-builder.php

ChartView Pro (for screener.in)
Enhances Screener.in with interactive charts, smart value highlighting, and TradingView integration for financial analysis ChartView Pro enhances Screener.in with powerful visualization and analysis tools. ✨ KEY FEATURES: - Interactive charts for Various sections such as P&L, Balance Sheet and Cash Flow - Smart highlighting of highest/lowest values in financial tables - One-click TradingView integration for technical analysis - Customizable settings panel with preferences - Clean, professional interface that matches Screener.in design 🎯 PERFECT FOR: - Stock market investors and analysts - Financial researchers and students - Anyone using Screener.in for company analysis 🔒 PRIVACY-FIRST: - No data collection or tracking - Works entirely in your browser - No external data transmission Transform your Screener.in experience with professional chart visualization tools!

sovrenn-to-tv-and-screener
Accessing Sovrenn stocks on TradingView and Screener 📈 Sovrenn to TradingView and Screener Extension The extension allows users to directly navigate from Sovrenn stocks to TradingView Charts or Screener pages.