
ndjddfkhomfpilckgiejcknepjkpllbh
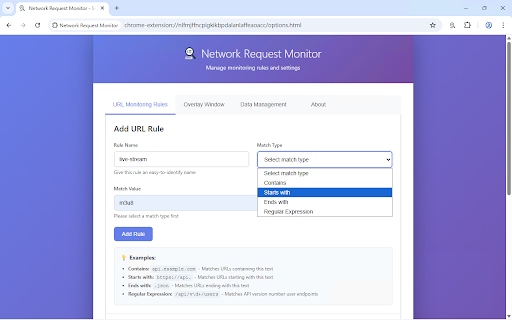


Monitor and capture network requests matching specified URL patterns A powerful Chrome extension that monitors network requests on web pages and finds specific URLs based on custom rules. - 🔍 **Real-time Monitoring**: Automatically monitors all network requests on active tabs - 📋 **Custom Rules**: Supports multiple matching patterns (contains, starts with, ends with, regex) - 📌 **Page Overlay Display**: Shows notification boxes on pages when matching URLs are found - 🎯 **Tab Filtering**: Option to display URLs from all tabs or current tab only - 📊 **Unified Management**: View all found URLs in the popup window - ⚙️ **Flexible Settings**: Easily manage matching rules through the options page - 📋 **One-click Copy**: Quickly copy found URLs

RequestScope
Monitor network requests and API failures with real-time insights 🚀 RequestScope – The Ultimate Network Monitor, API Debugger & Analytics Tool for Web Professionals! RequestScope is a professional-grade Chrome extension designed for developers, QA engineers, product managers, and advanced users. It seamlessly monitors, analyzes, and mocks network requests directly from your browser—without needing external tools like Postman or Charles Proxy. Whether you're debugging elusive API failures, optimizing page load times, mocking responses for UI testing, or analyzing third-party tracking scripts, RequestScope gives you unparalleled visibility into the network layer. 🎭 Intelligent API Mocking – Intercept and mock API responses on the fly. Test different UI states, error handling, and edge cases instantly without changing backend code. 🤖 AI-Powered "Hostile Roasts" – Get your website's performance and network health hilariously roasted (and critiqued) by AI based on real-time data! 📊 Full Payload Capture Details – Inspect request bodies, response payloads, hidden headers, and timing metrics in a clean, syntax-highlighted UI. 💾 Persistent Session Storage – Network history is preserved securely across browser restarts. Close Chrome and come back later without losing your session data! 🔍 Smart E2E Navigation Grouping – Requests are logically grouped by "Previous Load" and "Current Load", so you know exactly which actions triggered which API calls. 🛠️ Advanced API Debugging & Inspection Monitor all XHR, Fetch, Script, Document, Image, and Web Socket requests. Instantly identify 4xx and 5xx errors with color-coded alerts and visual UI indicators. Deep-dive into request and response bodies (JSON, Text, Form Data, URL params) with syntax highlighting and automatic formatting. Compare differences between two similar requests with built-in diffing tools. ⏱️ Performance & Speed Optimization Analyze page load times with precision metrics (Navigation Timing API & Fallbacks). Identify the top 10 slowest endpoints dragging down your application's UX. Monitor "Time to First Byte" (TTFB) and total request durations to optimize your Critical Rendering Path. 📈 Intelligent Analytics & Reports Generate comprehensive, shareable HTML Performance Reports with a single click. View total bandwidth weight, success/error ratios, and resource categorization charts. Track analytics across all domains with the "Full History Archive" or isolate data to the "Current Page". 🎯 Laser-Focused Filtering & Allowlisting Cut the noise. Use powerful allowlisting and domain targeting so you only capture requests for the websites you actually care about. Mute specific URLs, noisy analytics trackers, or third-party ads to keep your logs clean. Advanced Regex and glob pattern support for ultimate control over what gets captured. 🔔 Real-Time Toaster Notifications Get unobtrusive, in-page toaster alerts the exact millisecond an API fails or a request is dangerously slow. Configure custom thresholds (e.g., alert me if any request takes > 3 seconds). 🛡️ Privacy-First & Secure Runs entirely locally in your browser context. We do not track you, we do not collect telemetry, and your data never leaves your machine. All request history is stored securely using browser-native IndexedDB and Extension Local Storage. 👨💻 WHO IS REQUESTSCOPE FOR? Frontend Developers: Mock APIs while the backend is still being built. Debug CORS errors, missing headers, and malformed JSON payloads instantly. Backend Developers: Verify that your endpoints are returning the correct data shapes and HTTP status codes in the wild. QA Engineers & Testers: Capture E2E test failures, export HAR files or Postman collections, and attach full network traces to bug reports. Product Managers & SEO Experts: Monitor third-party script bloat, track page load speeds, and verify analytics firing correctly. 💡 HOW TO USE IT Install RequestScope. Click the extension icon to open the popup. Add your target website domain (e.g., localhost or yourdomain.com) to the Allowlist in Settings. Browse your site! RequestScope will silently capture, categorize, and analyze the traffic. Click any request to view full details, mock the response, or generate a final report. ⚡ Stop guessing why your web app is broken. Start debugging with precision. Install RequestScope today!

Page Request URL Monitor
A great helper for development debugging! Supports multiple formatting styles and custom output formats. This is a powerful tool that helps you gain deep insights into how web pages work behind the scenes! Monitor network requests in real time: Clearly see all the requests made by your browser when loading a webpage, including the request URL, response status, and more. Debug network issues: Quickly locate the root cause of problems like slow page loading, missing images, and failed API calls. Analyze website performance: Identify bottlenecks that slow down page loading, such as large images or redundant requests, and optimize website performance accordingly. Customize formatting and copy results: Adjust the formatting to your preference and batch copy problematic domains for further inspection. Why do you need it? Web developers: An essential tool for debugging frontend code, analyzing website performance, and testing APIs. Website administrators: Monitor website health, detect potential issues, and optimize user experience. General users: Monitor the health of links to the website and handle proxies independently. Release Note: 0.3.3(2025-06-18) Improve page readability.

Tab Network Traffic Monitor
Monitor, analyze, and report each Chrome tab's network traffic, data usage, and connections in real-time. Monitor, analyze, and report the network traffic, data usage, and connections of each Chrome tab in real-time. (Her bir Chrome sekmesinin ağ trafiğini, veri kullanımını ve kurduğu bağlantıları gerçek zamanlı olarak izleyin, analiz edin ve raporlayın.)

Network Request Capturer Pro
Professional network debugging tool. Capture, analyze and export HTTP requests with advanced filtering. Uncover every HTTP / HTTPS request and response made by your browser in real-time—no DevTools noise, no guess-work. Network Request Capturer Pro is the all-in-one Chrome extension for frontend & backend developers, QA, DevOps, performance engineers and security auditors. KEY FEATURES • One-click capture – start / stop live traffic recording without leaving the page. A dedicated "Reload & Capture" button guarantees you never miss early-load requests. • All File-Type Filtering – instantly silence Images, Stylesheets, Media and Docs, plus **10 Pro-only categories**: JavaScript, Source-maps, Fonts, Archives, Data formats, WebAssembly & more. • Unlimited sessions (Pro) – free users capture 100 requests per session; Pro users capture **unlimited** requests with zero slow-down. • cURL generation – every request is auto-converted into a ready-to-run `curl` command for Postman-style replay, CI pipelines or security scanners. • JSON export & clipboard – copy or **download** structured JSON with full request + response bodies, headers, status codes and timing. • Targeted exports (Pro) – export **only successful**, **only failed**, or **all** requests for laser-focused debugging. • Visual analytics (Pro) – instant breakdowns by file-type, success / failure rate and top endpoints; interactive tooltips reveal individual filenames. • Tab-scoped sessions – seamlessly switch tabs; the extension detaches from previous sessions to avoid unwanted spying. • Privacy-first – processes data **100 % locally**. Nothing is sent to third-party servers. Minimal permissions (activeTab, debugger, downloads, storage) keep Chrome happy. WHY DEVELOPERS LOVE IT • Faster than DevTools Network—zero waterfalls, zero clutter. • Exports drop straight into ChatGPT / Gemini for instant AI debugging. • Perfect for REST, GraphQL, WebSockets (handshake) & 3rd-party SDK calls. • Reproduce bugs instantly by sharing a single JSON file or curl snippet. UPGRADE TO PRO Activate a lifetime license to unlock advanced filters, unlimited JSON downloads, targeted exports and deep analytics—supercharge your workflow for less than the cost of a coffee. Get Network Request Capturer Pro today and turn raw traffic into actionable insight.