
jneeammdkdmlfgidcacmjmbijdmkdbjm

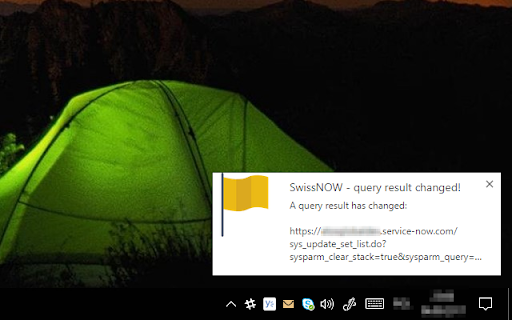
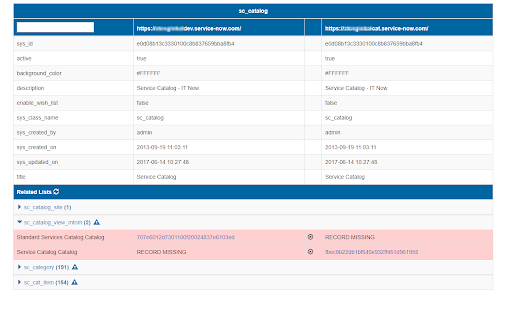
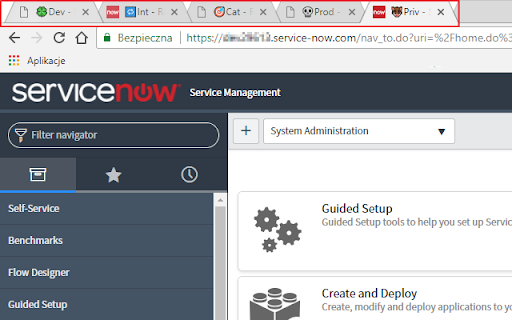
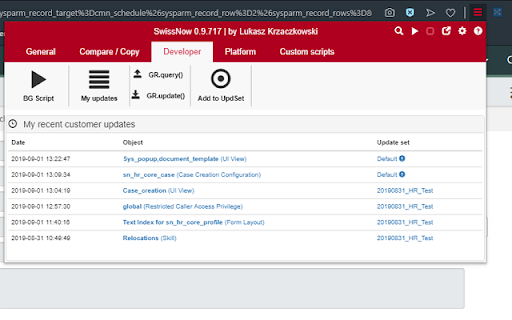
Swiss Knife for ServiceNOW. Lightweight toolbox for ServiceNOW. Using SwissNow, you can: 1. Check current logged in user, selected Update Set, Scope and Domain 2. Check plaftorm information (e.g. nodes). Switch active node. 3. Switch to the same record/view in another ServiceNow environment 4. View recent changes tracked in Update Sets 5. Custom utility scripts (= parametrized background scripts) 6. Configuration packages - export records from multiple tables into single file with just one click 7. Compare the same record or the same list of records on different environments. Multi-line values (e.g. scripts) highlights changed lines. Comparison of workflow activities on a list (wf_activity_list.do) includes activity variables (e.g. script in RunScript action) 8. Compare all rows/records in a list with each other 9. Add a prefix in your tab title - the prefix will indicate the ServiceNow environment you're connected to 10. Watch list. You can monitor a result of a list query. Once list content has been changed, you will receive a desktop notification from Chrome. 11. Embed current view in the ServiceNow UI. Pop-pop current view from the ServiceNow UI 12. Generate GlideRecord code for selected query 13. Edit ServiceNow background scripts locally, using your favourite IDE/editor (press CTRL-Enter to execute script) 14. Cancel your long-running blocking transactions 15. Search table by name 16. Context menu search global search 17. Add arbitrary records to an update set There is a separate version of the plugin to be used with OnPrem ServiceNow instances.

ServiceNow Small Tool
A small tool for ServiceNow. Move the current form or list to the ServiceNow frame (with menus "All", "Favorites", "History",… A small tool for ServiceNow. Move the current form or list to the ServiceNow frame (with menus "All", "Favorites", "History", etc.). Access the list of the current table with a button. Available for U16 and Next Experience UI.

ServiceNow Monitor
Monitor ServiceNow Lists and Notify changes ServiceNow Monitor is a chrome extension for scrapping and monitoring ServiceNow lists in the Agent workspace. The extension monitors changes to the lists in the background and sends notifications if new items are available avoiding the need to constantly manually refresh the list and monitor the window. (Personal work, not affiliated to ServiceNow). Not just that - The extension also allows you to scrape any list in ServiceNow and download the list in a JSON format.

UI Builder Dock for ServiceNow
A lightweight utility that enhances ServiceNow UI Builder development by making key parts easier to explore and understand. UI Builder Dock makes your ServiceNow development smoother and faster by giving you the best possible overview of all key parts of both the UI Builder and Configurable Workspace. 🗂️ Data Resources - see Inputs, Events and Usage - quickly open the backend record 🧠 State - state overview incl. data types and values 📜 Client Scripts - formatted client scripts from the UIB page ⚙️ Properties - page properties overview incl. data types and values 🎯 Events - see what events your page Dispatch and Handles 🌟 Workspace Dock - floating panel for Configurable Workspace 🕵️♂️ Workspace Inspector (beta) - configuration overview of your workspace 🌳 Component Tree - your UI Builder implementation overview 🔍 Search - quickly find Experience, Page collections or Components 📝 Notes - small feature for taking notes 🧮 JSON Validator - validate, format and copy JSON with no external sites needed 🛡️ Source code is publicly available on GitHub for full transparency and audit.

Next Experience Developer Tools
Debugging/Profiling tools for your ServiceNow Next Experiences. The extension is composed of two panels: Next Exp Inspector and Next Exp Profiler. The Next Exp Inspector has the capability to observe page behavior and access component details via seven distinct tabs. • Home: view indicators to help identify areas of improvement • Components: analyze the DOM tree and inspect a component’s properties, state and actions. • Events: view a list of events occurring in a page and generate a new custom event when needed for testing. • Traces: view interactions of a page and an execution hierarchy to see relationship between items and their duration • Logs: view a list of logs that have been emitted across the page. • Versions: a list of all asset versions on the instance • Service Workers: debugging service worker info on the instance Next Exp Profiler allows you to create, manage, and compare profiles for optimizing page performance proactively. • Profile: view detailed information about the page execution to understand its performance and opportunities for optimizations. • Compare: See what has changed between two profiles by viewing differences across different event types. This helps identify areas of focus when troubleshooting performance degradation. Right-click and use "ServiceNow Tools" to navigate to UI Builder and other builders from the current page.