
gnppgjflfhgdinlmpphhmpkhlllcbkfc
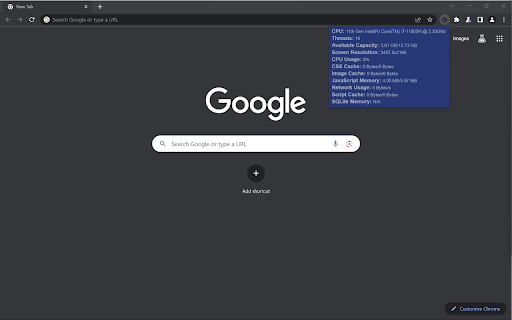
Gives system and tab information for developers. This extension was created mainly as practice for me working with Chrome extensions and its API. This extension can be used to monitor multiple system and tab-specific metrics including: CPU model, number of threads, memory capacity, screen resolution, CPU usage, CSS cache, image cache, JavaScript memory, network usage, script cache, and SQLite memory.

CPU Benchmark Finder
Performs a CPU Benchmark search from selected text on web page by using contextual menu button. Performs a CPU Benchmark search from selected text on web page by using contextual menu button.

Performance Metrics
Displays system performance metrics (CPU & Memory) directly on the toolbar icon and integrates with DevTools for deeper insights. Performance Monitor is a comprehensive development tool that provides real-time insights into web application performance metrics. It helps developers identify bottlenecks and optimize their web applications through detailed monitoring and visualization. Key Features: • FPS (Frames Per Second) monitoring - Track page rendering performance • Memory Usage Analysis - Monitor JS heap usage and memory consumption • Network Activity - Track requests, data transfer, and resource timing • CPU Usage Monitoring - Real-time CPU utilization metrics • DOM Analytics - Monitor DOM elements, nodes, and event listeners • Layout Shift Tracking - Measure Cumulative Layout Shift (CLS) • Resource Timing - Track resource loading performance • Interactive Charts - Visual representation of all metrics • Real-time Updates - Continuous monitoring with 1-second intervals Perfect for: - Web developers optimizing application performance - Performance engineers conducting analysis - QA teams monitoring application behavior - DevOps monitoring production applications The extension integrates seamlessly with Chrome DevTools, providing a dedicated panel for all performance metrics.

CPU Info
Shows details about your CPU! Show information about your CPU

Browser Performance Monitoring for ControlUp VDI & DaaS
Improve visibility into the performance of Google Chrome and Microsoft Edge. Works with ControlUp for VDI & DaaS v9.0.5 and above ControlUp for VDI & DaaS offers an end-to-end view of end-user computing environments, including Citrix, Omnissa and Microsoft Azure Virtual Desktop, by gathering true real-time performance metrics, enabling IT to swiftly identify, troubleshoot, and resolve issues before they hinder employees' digital experience and productivity. Introduced with Real-Time DX v9.0.5, this browser extension improves visibility into the performance of Google Chrome and Microsoft Edge browsers, by collecting Browser URL and Browser Tab Title information on a per process basis. This will allow IT administrators to identify performance issues caused by specific web pages that might affect the overall performance of the user session or even other users sharing the same infrastructure. These new metrics can also be used as conditions in triggers for ControlUp's automation feature.