
dmggabnehkmmfmdffgajcflpdjlnoemp
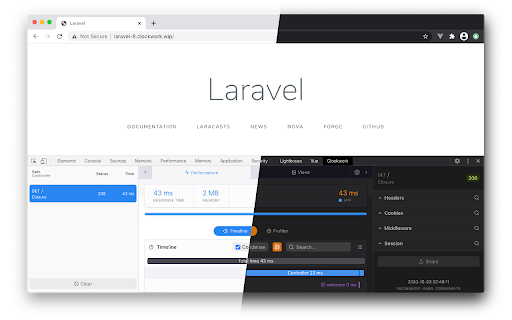
php dev tools integrated to your browser Clockwork is a development tool for PHP available right in your browser. Clockwork gives you an insight into your application runtime - including request data, performance metrics, log entries, database queries, cache queries, redis commands, dispatched events, queued jobs, rendered views and more - for HTTP requests, commands, queue jobs and tests. Install the Clockwork server-side component via Composer to collect all the metrics. Includes a first-class Laravel support, easy integration with vanilla or custom apps. Read the full installation guide on the Clockwork website - https://underground.works/clockwork/#documentation

Alpine.js devtools
DevTools extension for debugging Alpine.js applications. Alpine.js devtools is a Chrome extension for the Alpine.js JavaScript library. It allows you to detect, inspect and edit Alpine.js data and components in the Chrome Developer Tools. After installing you will see a new tab in the Chrome DevTools. This Alpine.js tab displays a list of Alpine.js components that are rendered on the page. By selecting one of the components in the list, you can inspect and edit its current data in the panel to the right. The ability to change data on the fly helps with debugging Alpine.js components. If your application uses Alpine stores or encounters evaluation errors, the stores and warnings tabs will be populated.

var_masterpiece
Turn a PHP var_dump into a readable, collapsible piece of art! JSONView for var_dump's Turns ugly var_dumps into something much, much better: collapsible, syntax aware, and readable! If you want to make PHP debugging easier, this extension is for you. It is JSONView for php var_dumps. Reading var_dumps without formatting is very difficult. This is a chrome extension to make var_dumps more user friendly. It works great to debug WordPress, Yii, Laravel, and any other PHP framework! This extension is like JSONView for PHP

Blackfire Profiler
Profile your applications from your browser. Blackfire helps you monitor your web applications performance, visualise and understand the hot spots, directly during development as well as on production servers with a very low overhead. The web browser companion makes it easy to profile any page within the browser.

Xdebug Helper by JetBrains
A modern, dependency-free, extension for Xdebug Allows controlling Xdebug sessions by managing cookies for debugging, profiling, and tracing. Configure IDE key, profile, and trigger values through an intuitive interface.