
dhblhhdhopbjbodknlkaajhbjefaoogf
This project is a sophisticated AI-powered tool designed to enhance the user experience on the `screener.in` website by allowing users to "chat" with financial documents. The system consists of two main components: a frontend Chrome Extension and a backend Python API deployed on the cloud. * **Integrated UI**: Injects a sleek, modern sidebar directly into the `screener.in` webpage, creating a seamless user experience. * **Automatic Document Detection**: Automatically finds the 10 most recent "Concall" transcripts on the page and populates them in a dropdown for easy selection. * **AI-Powered Chat**: Allows users to ask questions in natural language about the selected transcript and receive answers generated by the GPT-4 model. * **Suggested Questions**: Provides users with one-click suggested questions to initiate the conversation with the document. * **Cloud-Native Backend**: The API is designed to be deployed as a serverless function on Vercel for scalability and reliability. ### Frontend (Chrome Extension) The frontend is a Chrome Extension built with JavaScript that modifies the `screener.in` website. Its core logic resides in `content.js`, which is responsible for injecting the sidebar UI, finding the relevant transcripts, handling user input from the chat interface, and communicating with the backend API. While it includes files for a browser popup (`popup.html`, `popup.js`), the primary interface is the sidebar. The backend is a Python API built using the FastAPI framework. It exposes a single `/ask` endpoint that performs the following actions: 1. Receives a PDF URL and a question from the frontend. 2. Downloads the PDF content into memory. 3. Uses the `PyMuPDF` library (`fitz`) to extract text from the in-memory data. 4. Constructs a prompt containing the transcript text and the user's question. 5. Sends the prompt to the OpenAI GPT-4 model to generate a relevant answer. 6. Returns the answer to the frontend to be displayed in the chat window. The API includes CORS middleware to allow requests from the Chrome extension.

Screener.in Better Results Highlighter
Welcome to Screener.in Better Results Highlighter, the ultimate Chrome extension designed to revolutionize your financial analysis experience on Screener.in. With our tool, deciphering Profit and Loss (P&L) statements becomes not only effortless but also more insightful. Intelligent Highlighting: Our extension automatically identifies and highlights key metrics within P&L statements. If a metric reflects positive performance, such as increasing revenue or decreasing expenses, the corresponding cell is highlighted in a vibrant green color. This intuitive visual cue allows users to swiftly pinpoint areas of financial strength. Percentage Improvement Indicator: For essential quarterly and annual metrics, Screener.in Better Results Highlighter goes beyond highlighting. When hovering over individual cells, the extension displays the percentage improvement or decline compared to the previous period. This feature provides invaluable context, enabling users to assess the company's trajectory over time with ease. Seamless Integration: Once installed, Screener.in Better Results Highlighter seamlessly integrates into your browsing experience. Simply navigate to the P&L section of any company on Screener.in, and our extension will automatically enhance the visibility and interpretability of the financial data. There's no need for manual data entry or complex setup processes. Time-Saving Efficiency: By streamlining the analysis process and providing instant insights, our extension saves you valuable time. Say goodbye to laboriously poring over rows and columns of financial figures. With Screener.in Better Results Highlighter, you can focus your energy on interpreting the implications of the highlighted metrics and making informed investment decisions swiftly. Visit the Chrome Web Store and search for "Screener.in Better Results Highlighter." Click on the "Add to Chrome" button to install the extension. Once installed, navigate to Screener.in and access the P&L statements of any company. Observe the automatic highlighting of positive metrics and hover over cells to view percentage improvements. Investment Research: Whether you're an experienced investor or a newcomer to the stock market, our extension provides valuable insights to inform your investment decisions. Quickly identify companies with strong financial performance and growth potential. Financial Analysis: Financial analysts and professionals can leverage Screener.in Better Results Highlighter to expedite their analysis process. Spend less time on data manipulation and more time on strategic analysis and forecasting. Educational Tool: For students or enthusiasts interested in learning about financial analysis, our extension serves as an educational resource. By visualizing key financial metrics and trends, users can deepen their understanding of corporate finance concepts. Screener.in Better Results Highlighter empowers users to unlock the full potential of financial data on Screener.in. With its intuitive features, seamless integration, and time-saving efficiency, this extension is a must-have for anyone involved in company analysis or investment research. Install now and elevate your financial analysis to new heights!

Screener QoQ And YoY Growth Tracker
Enhanced financial analysis tool for Screener.in - adds Quarter-over-Quarter and Year-over-Year growth metrics 🎯 TRANSFORM YOUR SCREENER.IN EXPERIENCE WITH INSTANT GROWTH ANALYSIS Tired of manually calculating Quarter-over-Quarter and Year-over-Year growth rates while analyzing stocks on Screener.in? This powerful Chrome extension does it automatically, adding professional-grade growth metrics and stunning visualizations right where you need them! ✨ KEY FEATURES THAT SAVE YOU TIME 📊 AUTOMATIC GROWTH CALCULATIONS Every quarter on Screener.in now shows: • QoQ% (Quarter-over-Quarter): Compare each quarter with the previous one • YoY% (Year-over-Year): Compare with the same quarter last year • Instant calculations for Sales, Operating Profit, and all financial metrics • Smart handling of negative values, percentages, and missing data 📈 BEAUTIFUL INTERACTIVE CHARTS (5 Per Company!) Visualize growth trends instantly with professional charts: SALES ANALYSIS: • QoQ Line Chart - Track quarterly sales momentum over time • QoQ Bar Chart - Visual comparison with color-coded bars • YoY Combined Chart - Long-term view showing Sales + Operating Profit together Each chart features: ✓ Responsive design that adapts to your screen ✓ Interactive tooltips showing exact percentages ✓ Clean, professional styling matching Screener.in's look ✓ Smooth animations and intuitive controls 🎨 SMART COLOR-CODED INSIGHTS Never miss a trend with intelligent visual indicators: • 🟢 GREEN points/bars = Value INCREASED from previous period • 🔴 RED points/bars = Value DECREASED from previous period • 📊 Each data point colored based on actual performance • 💡 Instantly spot growth acceleration or deceleration ⚙️ CUSTOMIZABLE & USER-FRIENDLY Complete control at your fingertips: • Toggle ON/OFF with a single click • Customize decimal precision (0-4 decimal places) • Settings persist across browser sessions • Non-intrusive design that enhances, not disrupts • Works seamlessly with Screener.in's existing features 🚀 PERFECT FOR 📈 INVESTORS • Quick screening of quarterly performance across multiple companies • Identify consistent growth patterns without spreadsheets • Spot seasonal trends and business cycles instantly • Make faster, data-driven investment decisions 📊 FINANCIAL ANALYSTS • Eliminate tedious manual calculations • Professional visualizations ready for reports • Comprehensive growth metrics at a glance • Focus on analysis, not data processing 💹 TRADERS • Rapid momentum assessment for short-term positions • Visual confirmation of fundamental trends • Detect accelerating or decelerating growth immediately • Compare multiple companies efficiently 1. INSTALL THE EXTENSION One-click installation from Chrome Web Store - takes 5 seconds! 2. VISIT SCREENER.IN Go to any company page (e.g., Reliance, TCS, Infosys, etc.) Both consolidated and standalone results are supported 3. ANALYZE INSTANTLY • Scroll to "Quarterly Results" section • See QoQ% and YoY% columns automatically added • Charts appear below the table • Start analyzing growth trends immediately! 🔍 SMART FEATURES UNDER THE HOOD INTELLIGENT DATA DETECTION: • Automatically finds "Sales" row in any table format • Recognizes multiple naming conventions: - "Operating Profit" - "Operating Income" - "Financing Profit" - "EBIT" • Handles consolidated and standalone results • Works with all Indian and international companies on Screener.in ROBUST DATA HANDLING: • Parses numbers with commas (1,23,456) • Handles percentages, negative values • Manages "N/A" and missing data gracefully • Supports various number formats PERFORMANCE OPTIMIZED: • Loads only after page resources are ready • Minimal memory footprint (~250KB including charts) • No lag or slowdown • Efficient DOM manipulation • Smart validation prevents errors 🔒 PRIVACY & SECURITY YOU CAN TRUST ✅ ZERO DATA COLLECTION • No analytics, tracking, or monitoring • Your browsing activity stays private • No personal information collected ✅ LOCAL PROCESSING ONLY • All calculations happen in your browser • No external server requests • No data leaves your device ✅ MINIMAL PERMISSIONS • Runs ONLY on Screener.in domain • Storage used only for your settings • Open source code on GitHub for transparency ✅ NO ADS, NO TRACKING • Completely free, no hidden costs • No advertisements or promotions • Built for the investor community SCENARIO 1: Quick Stock Screening You're researching 10 companies. Instead of opening Excel and calculating growth rates manually for each quarter, you simply browse their Screener.in pages. Each company shows instant QoQ/YoY metrics with visual charts. You complete your screening in 10 minutes instead of an hour! SCENARIO 2: Identifying Trends You notice a company's sales QoQ chart shows consistent green bars for 8 quarters. The YoY chart confirms 20%+ annual growth. The visual pattern immediately reveals a strong growth story that raw numbers might hide. SCENARIO 3: Comparative Analysis Comparing two competitors? Open their Screener.in pages in different tabs. The charts make it instantly obvious which company has better growth momentum, seasonal patterns, or profit margin expansion. • Built with modern Chrome Extension Manifest V3 • Powered by Chart.js 4.4.0 for professional visualizations • Pure JavaScript - no framework bloat • Responsive CSS for all screen sizes • Compatible with Chrome, Edge, Brave, Opera (Chromium-based) • Regular updates and improvements ✨ Initial Release Features: • Complete QoQ and YoY calculation engine • 5 interactive charts (Sales & Operating Profit) • Smart color-coded visual indicators • Customizable settings page • Optimized loading for reliability • Support for multiple profit naming conventions • Comprehensive error handling • Professional design matching Screener.in 📧 Need Help? • Visit our GitHub repository for documentation • Report issues or request features • Active community support ⭐ Show Your Appreciation • Rate this extension 5 stars • Share with fellow investors • Contribute to open source development 🔄 Regular Updates • Bug fixes and improvements • New features based on user feedback • Compatibility with Screener.in updates

Screener specter
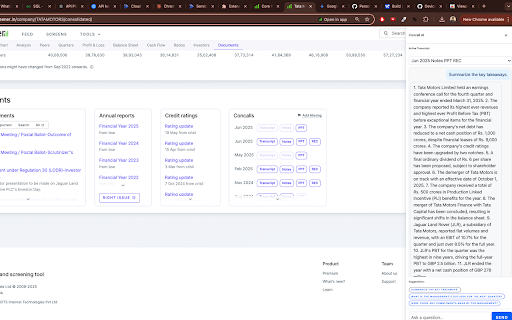
Simplify your investment research on screener Screener Specter - Real-Time Stock Analysis & Financial Insights for Screener.in Unlock the full potential of your stock analysis with Screener Specter, the ultimate Chrome extension for Screener.in users. Enhance your financial insights with real-time data, advanced analysis tools, and a comprehensive forensic summary directly within Screener.in. Perfect for investors and financial analysts, Screener Specter simplifies and revolutionises your stock evaluation process. ⭐ Features: 1. 🚀 INDUSTRY-SPECIFIC INTELLIGENCE: Gone are the days of generic summaries! We've rolled out 190+ specialized AI models, one for every industry on the Indian stock market. Whether it's a bank, a pharma company, or a steel manufacturer, you now get summaries with the exact KPIs and terminology that analysts use. 2. 🎯 AUTOMATIC TARGET EXTRACTION: Our AI now automatically identifies and lists all forward-looking targets and commitments made by management during the call. Instantly see a "Management Scorecard" with specific goals for revenue, margins, capex, and project timelines, all in one place. 3. Real-Time Data for Screener.in: Stay updated with the latest financial data as you browse company profiles. 4. Volume Analysis: Gain insights into volume trends with detailed bar charts showing total and delivery volumes over multiple timeframes. 5. Support & Resistance Levels: Identify key support and resistance levels, ranked by strength and closeness to the current price. 6. Historical Valuations: Explore historical valuations based on PE, PB, EV/EBITDA, and Market Cap to Sales, providing context for your investment decisions. ========================================== Version 1.9.0 || Jun 26, 2025 ========================================== - ✨ Introduced pre-registration for the Specter Finance web app. - 🎨 UI/UX Improvement: Enhanced the user experience with an improved overall structure and updated font styles for better readability. - Minor bug fixes and performance enhancements. ============================== Version 2.3 || May 27, 2026 ============================== - Under the hood improvements and performance enhancements. ========================================== Version 1.7.0 || Jun 26, 2025 ========================================== - ✨ Major Upgrade: Introduced Industry-Specific Intelligence with over 190+ tailored AI models for hyper-relevant, KPI-driven analysis. - 🎯 New Feature: Added Automatic Target Extraction to instantly identify and list all forward-looking guidance and commitments from management. - ⚙️ Engine Improvement: Upgraded the core AI prompt library for enhanced accuracy and deeper insights across all sectors. - Minor bug fixes and performance enhancements. ============================== Version 1.6.0 || Oct 16, 2024 ============================== - Added Volume Analysis with detailed insights on total and delivery volumes over various timeframes. - Introduced Support & Resistance levels, ranked by strength and proximity to current price. - Minor bug fixes and UI improvements. ============================== Version 1.5.2 || Sep 27, 2024 ============================== - Added new forensic i.e. Equity Dilution. - Various bug fixes and performance enhancements. ============================== Version 1.5 || Sep 17, 2024 ============================== - Introduced detailed valuation insights: - P/E Percentile Score - P/B Percentile Score - EV/EBITDA Percentile Score - Market Cap/Sales Percentile Score - Improved user interface for better navigation and readability. - Various bug fixes and performance enhancements. ============================== Version 1.4 || Sep 6, 2024 ============================== - Updated font sizes for improved readability. - Added direct links to TradingView charts. - Various minor bug fixes. ============================== Version 1.1 || Aug 10, 2024 ============================== - Fixes for NBFCs and Banks - Minor Fixes 1. Install Screener Specter from the Chrome Web Store. 2. Navigate to screener.in and select the company you want to analyse. 3. Once the company page loads, click on the drawer at the top right corner to view the forensic summary. 4. Review key metrics and make data-driven investment decisions. Install Screener Specter today to revolutionise your stock analysis on Screener.in! Whether you're a seasoned investor or just starting out, our extension provides the tools you need for smarter, more efficient stock evaluation. ⭐ About Us: Screener Specter is developed by a dedicated solo developer committed to enhancing your stock analysis experience. We value your feedback and suggestions. If you encounter any issues or have ideas for improvement, please let us know. Experience a smarter way to analyse stocks. Install Screener Specter now and take your investment journey to the next level!

ChartView Pro (for screener.in)
Enhances Screener.in with interactive charts, smart value highlighting, and TradingView integration for financial analysis ChartView Pro enhances Screener.in with powerful visualization and analysis tools. ✨ KEY FEATURES: - Interactive charts for Various sections such as P&L, Balance Sheet and Cash Flow - Smart highlighting of highest/lowest values in financial tables - One-click TradingView integration for technical analysis - Customizable settings panel with preferences - Clean, professional interface that matches Screener.in design 🎯 PERFECT FOR: - Stock market investors and analysts - Financial researchers and students - Anyone using Screener.in for company analysis 🔒 PRIVACY-FIRST: - No data collection or tracking - Works entirely in your browser - No external data transmission Transform your Screener.in experience with professional chart visualization tools!